Ceres Inc.'s (TSE:3696) Stock is Soaring But Financials Seem Inconsistent: Will The Uptrend Continue?


Ceres (TSE:3696) has had a great run on the share market with its stock up by a significant 30% over the last week. But the company's key financial indicators appear to be differing across the board and that makes us question whether or not the company's current share price momentum can be maintained. Particularly, we will be paying attention to Ceres' ROE today.
Return on equity or ROE is a key measure used to assess how efficiently a company's management is utilizing the company's capital. In simpler terms, it measures the profitability of a company in relation to shareholder's equity.
Check out our latest analysis for Ceres
How Is ROE Calculated?
Return on equity can be calculated by using the formula:
Return on Equity = Net Profit (from continuing operations) ÷ Shareholders' Equity
So, based on the above formula, the ROE for Ceres is:
7.2% = JP¥799m ÷ JP¥11b (Based on the trailing twelve months to June 2024).
The 'return' is the amount earned after tax over the last twelve months. One way to conceptualize this is that for each ¥1 of shareholders' capital it has, the company made ¥0.07 in profit.
What Has ROE Got To Do With Earnings Growth?
We have already established that ROE serves as an efficient profit-generating gauge for a company's future earnings. Depending on how much of these profits the company reinvests or "retains", and how effectively it does so, we are then able to assess a company’s earnings growth potential. Assuming all else is equal, companies that have both a higher return on equity and higher profit retention are usually the ones that have a higher growth rate when compared to companies that don't have the same features.
A Side By Side comparison of Ceres' Earnings Growth And 7.2% ROE
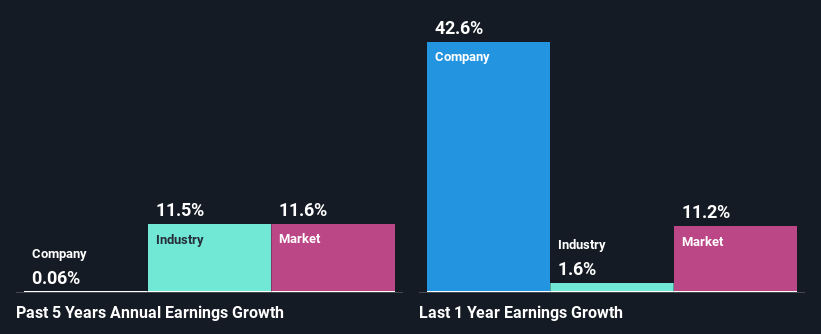
At first glance, Ceres' ROE doesn't look very promising. Yet, a closer study shows that the company's ROE is similar to the industry average of 7.3%. Still, Ceres has seen a flat net income growth over the past five years. Bear in mind, the company's ROE is not very high. So that could also be one of the reasons behind the company's flat growth in earnings.
We then compared Ceres' net income growth with the industry and found that the company's growth figure is lower than the average industry growth rate of 12% in the same 5-year period, which is a bit concerning.
Earnings growth is an important metric to consider when valuing a stock. It’s important for an investor to know whether the market has priced in the company's expected earnings growth (or decline). This then helps them determine if the stock is placed for a bright or bleak future. Is Ceres fairly valued compared to other companies? These 3 valuation measures might help you decide.
Is Ceres Using Its Retained Earnings Effectively?
Ceres has a low three-year median payout ratio of 24% (or a retention ratio of 76%) but the negligible earnings growth number doesn't reflect this as high growth usually follows high profit retention.
Additionally, Ceres has paid dividends over a period of six years, which means that the company's management is determined to pay dividends even if it means little to no earnings growth.
Summary
Overall, we have mixed feelings about Ceres. While the company does have a high rate of profit retention, its low rate of return is probably hampering its earnings growth. Up till now, we've only made a short study of the company's growth data. So it may be worth checking this free detailed graph of Ceres' past earnings, as well as revenue and cash flows to get a deeper insight into the company's performance.
New: AI Stock Screener & Alerts
Our new AI Stock Screener scans the market every day to uncover opportunities.
• Dividend Powerhouses (3%+ Yield)
• Undervalued Small Caps with Insider Buying
• High growth Tech and AI Companies
Or build your own from over 50 metrics.
Have feedback on this article? Concerned about the content? Get in touch with us directly. Alternatively, email editorial-team (at) simplywallst.com.
This article by Simply Wall St is general in nature. We provide commentary based on historical data and analyst forecasts only using an unbiased methodology and our articles are not intended to be financial advice. It does not constitute a recommendation to buy or sell any stock, and does not take account of your objectives, or your financial situation. We aim to bring you long-term focused analysis driven by fundamental data. Note that our analysis may not factor in the latest price-sensitive company announcements or qualitative material. Simply Wall St has no position in any stocks mentioned.
About TSE:3696
Proven track record with adequate balance sheet.

