Hakuhodo DY Holdings (TSE:2433) shareholders have endured a 31% loss from investing in the stock three years ago


In order to justify the effort of selecting individual stocks, it's worth striving to beat the returns from a market index fund. But in any portfolio, there are likely to be some stocks that fall short of that benchmark. We regret to report that long term Hakuhodo DY Holdings Inc (TSE:2433) shareholders have had that experience, with the share price dropping 36% in three years, versus a market return of about 30%. The more recent news is of little comfort, with the share price down 24% in a year. Shareholders have had an even rougher run lately, with the share price down 24% in the last 90 days.
So let's have a look and see if the longer term performance of the company has been in line with the underlying business' progress.
View our latest analysis for Hakuhodo DY Holdings
To quote Buffett, 'Ships will sail around the world but the Flat Earth Society will flourish. There will continue to be wide discrepancies between price and value in the marketplace...' By comparing earnings per share (EPS) and share price changes over time, we can get a feel for how investor attitudes to a company have morphed over time.
Hakuhodo DY Holdings saw its EPS decline at a compound rate of 1.4% per year, over the last three years. The share price decline of 14% is actually steeper than the EPS slippage. So it's likely that the EPS decline has disappointed the market, leaving investors hesitant to buy.
You can see below how EPS has changed over time (discover the exact values by clicking on the image).
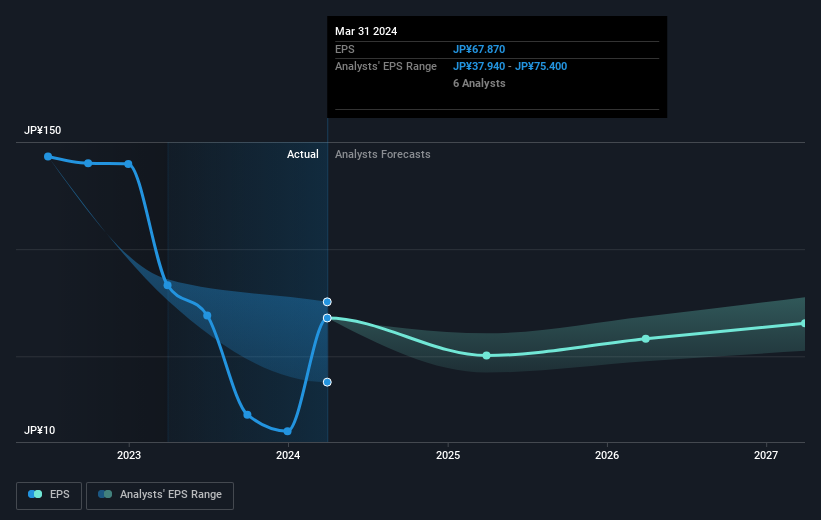
Dive deeper into Hakuhodo DY Holdings' key metrics by checking this interactive graph of Hakuhodo DY Holdings's earnings, revenue and cash flow.
What About Dividends?
It is important to consider the total shareholder return, as well as the share price return, for any given stock. The TSR is a return calculation that accounts for the value of cash dividends (assuming that any dividend received was reinvested) and the calculated value of any discounted capital raisings and spin-offs. So for companies that pay a generous dividend, the TSR is often a lot higher than the share price return. We note that for Hakuhodo DY Holdings the TSR over the last 3 years was -31%, which is better than the share price return mentioned above. And there's no prize for guessing that the dividend payments largely explain the divergence!
A Different Perspective
Hakuhodo DY Holdings shareholders are down 22% for the year (even including dividends), but the market itself is up 7.6%. However, keep in mind that even the best stocks will sometimes underperform the market over a twelve month period. Regrettably, last year's performance caps off a bad run, with the shareholders facing a total loss of 4% per year over five years. Generally speaking long term share price weakness can be a bad sign, though contrarian investors might want to research the stock in hope of a turnaround. While it is well worth considering the different impacts that market conditions can have on the share price, there are other factors that are even more important. Even so, be aware that Hakuhodo DY Holdings is showing 2 warning signs in our investment analysis , you should know about...
If you would prefer to check out another company -- one with potentially superior financials -- then do not miss this free list of companies that have proven they can grow earnings.
Please note, the market returns quoted in this article reflect the market weighted average returns of stocks that currently trade on Japanese exchanges.
Valuation is complex, but we're here to simplify it.
Discover if Hakuhodo DY Holdings might be undervalued or overvalued with our detailed analysis, featuring fair value estimates, potential risks, dividends, insider trades, and its financial condition.
Access Free AnalysisHave feedback on this article? Concerned about the content? Get in touch with us directly. Alternatively, email editorial-team (at) simplywallst.com.
This article by Simply Wall St is general in nature. We provide commentary based on historical data and analyst forecasts only using an unbiased methodology and our articles are not intended to be financial advice. It does not constitute a recommendation to buy or sell any stock, and does not take account of your objectives, or your financial situation. We aim to bring you long-term focused analysis driven by fundamental data. Note that our analysis may not factor in the latest price-sensitive company announcements or qualitative material. Simply Wall St has no position in any stocks mentioned.
About TSE:2433
Hakuhodo DY Holdings
Provides marketing and communications services in Japan and internationally.
Good value with adequate balance sheet and pays a dividend.
