
Advertisement
David Iben put it well when he said, 'Volatility is not a risk we care about. What we care about is avoiding the permanent loss of capital.' When we think about how risky a company is, we always like to look at its use of debt, since debt overload can lead to ruin. We note that Mory Industries Inc. (TSE:5464) does have debt on its balance sheet. But the real question is whether this debt is making the company risky.
Why Does Debt Bring Risk?
Debt is a tool to help businesses grow, but if a business is incapable of paying off its lenders, then it exists at their mercy. Ultimately, if the company can't fulfill its legal obligations to repay debt, shareholders could walk away with nothing. While that is not too common, we often do see indebted companies permanently diluting shareholders because lenders force them to raise capital at a distressed price. By replacing dilution, though, debt can be an extremely good tool for businesses that need capital to invest in growth at high rates of return. When we think about a company's use of debt, we first look at cash and debt together.
View our latest analysis for Mory Industries
How Much Debt Does Mory Industries Carry?
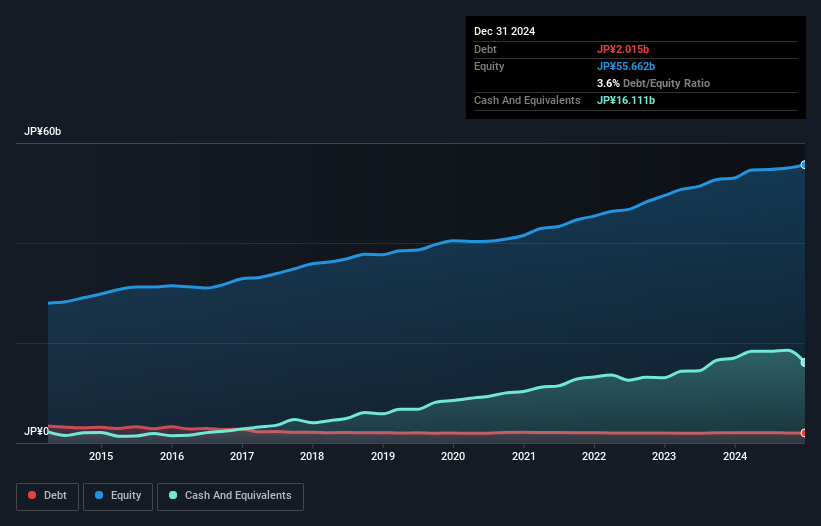
The chart below, which you can click on for greater detail, shows that Mory Industries had JP¥2.02b in debt in December 2024; about the same as the year before. However, its balance sheet shows it holds JP¥16.1b in cash, so it actually has JP¥14.1b net cash.
How Healthy Is Mory Industries' Balance Sheet?
Zooming in on the latest balance sheet data, we can see that Mory Industries had liabilities of JP¥13.0b due within 12 months and liabilities of JP¥2.38b due beyond that. On the other hand, it had cash of JP¥16.1b and JP¥15.3b worth of receivables due within a year. So it actually has JP¥16.0b more liquid assets than total liabilities.
This surplus strongly suggests that Mory Industries has a rock-solid balance sheet (and the debt is of no concern whatsoever). On this view, lenders should feel as safe as the beloved of a black-belt karate master. Succinctly put, Mory Industries boasts net cash, so it's fair to say it does not have a heavy debt load!
But the other side of the story is that Mory Industries saw its EBIT decline by 8.5% over the last year. If earnings continue to decline at that rate the company may have increasing difficulty managing its debt load. When analysing debt levels, the balance sheet is the obvious place to start. But it is Mory Industries's earnings that will influence how the balance sheet holds up in the future. So when considering debt, it's definitely worth looking at the earnings trend. Click here for an interactive snapshot.
But our final consideration is also important, because a company cannot pay debt with paper profits; it needs cold hard cash. Mory Industries may have net cash on the balance sheet, but it is still interesting to look at how well the business converts its earnings before interest and tax (EBIT) to free cash flow, because that will influence both its need for, and its capacity to manage debt. During the last three years, Mory Industries produced sturdy free cash flow equating to 61% of its EBIT, about what we'd expect. This cold hard cash means it can reduce its debt when it wants to.
Summing Up
While it is always sensible to investigate a company's debt, in this case Mory Industries has JP¥14.1b in net cash and a decent-looking balance sheet. So is Mory Industries's debt a risk? It doesn't seem so to us. Another positive for shareholders is that it pays dividends. So if you like receiving those dividend payments, check Mory Industries's dividend history, without delay!
At the end of the day, it's often better to focus on companies that are free from net debt. You can access our special list of such companies (all with a track record of profit growth). It's free.
New: Manage All Your Stock Portfolios in One Place
We've created the ultimate portfolio companion for stock investors, and it's free.
• Connect an unlimited number of Portfolios and see your total in one currency
• Be alerted to new Warning Signs or Risks via email or mobile
• Track the Fair Value of your stocks
Have feedback on this article? Concerned about the content? Get in touch with us directly. Alternatively, email editorial-team (at) simplywallst.com.
This article by Simply Wall St is general in nature. We provide commentary based on historical data and analyst forecasts only using an unbiased methodology and our articles are not intended to be financial advice. It does not constitute a recommendation to buy or sell any stock, and does not take account of your objectives, or your financial situation. We aim to bring you long-term focused analysis driven by fundamental data. Note that our analysis may not factor in the latest price-sensitive company announcements or qualitative material. Simply Wall St has no position in any stocks mentioned.
About TSE:5464
Mory Industries
Manufactures and sells stainless steel and welded carbon steel products in Japan.
Flawless balance sheet established dividend payer.
Market Insights

Advertisement
Community Narratives
MicroVision will explode future revenue by 380.37% with a vision towards success
Fair Value US$60.00|98.4% undervalued
TH
Community Contributor
The Indispensable Artery for a New North American Economy
Fair Value CA$132.87|1.3% undervalued
TI
Community Contributor