Investors more bullish on Takasago International (TSE:4914) this week as stock pops 16%, despite earnings trending downwards over past five years


If you want to compound wealth in the stock market, you can do so by buying an index fund. But you can do a lot better than that by buying good quality businesses for attractive prices. For example, the Takasago International Corporation (TSE:4914) share price is up 64% in the last five years, slightly above the market return. We're also happy to report the stock is up a healthy 53% in the last year.
Since the stock has added JP¥12b to its market cap in the past week alone, let's see if underlying performance has been driving long-term returns.
Check out our latest analysis for Takasago International
While markets are a powerful pricing mechanism, share prices reflect investor sentiment, not just underlying business performance. One flawed but reasonable way to assess how sentiment around a company has changed is to compare the earnings per share (EPS) with the share price.
Takasago International's earnings per share are down 11% per year, despite strong share price performance over five years.
This means it's unlikely the market is judging the company based on earnings growth. Because earnings per share don't seem to match up with the share price, we'll take a look at other metrics instead.
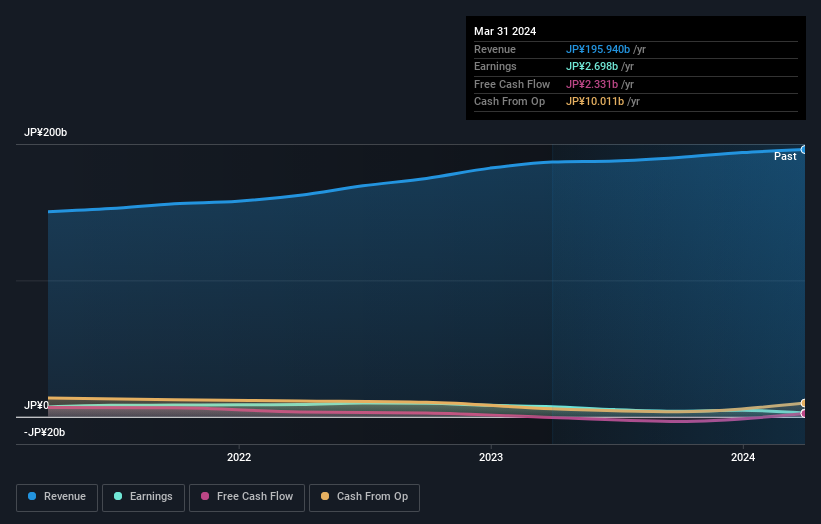
We doubt the modest 1.9% dividend yield is attracting many buyers to the stock. On the other hand, Takasago International's revenue is growing nicely, at a compound rate of 6.1% over the last five years. It's quite possible that management are prioritizing revenue growth over EPS growth at the moment.
You can see how earnings and revenue have changed over time in the image below (click on the chart to see the exact values).
Balance sheet strength is crucial. It might be well worthwhile taking a look at our free report on how its financial position has changed over time.
What About Dividends?
It is important to consider the total shareholder return, as well as the share price return, for any given stock. The TSR is a return calculation that accounts for the value of cash dividends (assuming that any dividend received was reinvested) and the calculated value of any discounted capital raisings and spin-offs. Arguably, the TSR gives a more comprehensive picture of the return generated by a stock. As it happens, Takasago International's TSR for the last 5 years was 85%, which exceeds the share price return mentioned earlier. The dividends paid by the company have thusly boosted the total shareholder return.
A Different Perspective
We're pleased to report that Takasago International shareholders have received a total shareholder return of 56% over one year. That's including the dividend. That's better than the annualised return of 13% over half a decade, implying that the company is doing better recently. Given the share price momentum remains strong, it might be worth taking a closer look at the stock, lest you miss an opportunity. It's always interesting to track share price performance over the longer term. But to understand Takasago International better, we need to consider many other factors. Take risks, for example - Takasago International has 1 warning sign we think you should be aware of.
For those who like to find winning investments this free list of undervalued companies with recent insider purchasing, could be just the ticket.
Please note, the market returns quoted in this article reflect the market weighted average returns of stocks that currently trade on Japanese exchanges.
Valuation is complex, but we're here to simplify it.
Discover if Takasago International might be undervalued or overvalued with our detailed analysis, featuring fair value estimates, potential risks, dividends, insider trades, and its financial condition.
Access Free AnalysisHave feedback on this article? Concerned about the content? Get in touch with us directly. Alternatively, email editorial-team (at) simplywallst.com.
This article by Simply Wall St is general in nature. We provide commentary based on historical data and analyst forecasts only using an unbiased methodology and our articles are not intended to be financial advice. It does not constitute a recommendation to buy or sell any stock, and does not take account of your objectives, or your financial situation. We aim to bring you long-term focused analysis driven by fundamental data. Note that our analysis may not factor in the latest price-sensitive company announcements or qualitative material. Simply Wall St has no position in any stocks mentioned.
About TSE:4914
Takasago International
Manufactures and sells flavors, fragrances, aroma ingredients, and other fine chemicals.
Flawless balance sheet average dividend payer.
