Zeon (TSE:4205) shares saw mild fluctuations following the company’s recent update on annual revenue growth, which came in at just under 2%. Investors appear to be weighing this modest progress in relation to previous results.
After a period of steady gains, Zeon's share price sits at ¥1,702. Strong momentum earlier this year has lifted the share price return to over 15% year-to-date, while the one-year total shareholder return stands at a healthy 22%. Longer-term holders have seen the effect of steady compounding, with a 49.6% total shareholder return over five years. Recent mild movement suggests the market is awaiting clearer signs of accelerating growth or a shift in risk perception.
With shares trading just below analyst targets and annual growth appearing modest, the big question now is whether Zeon is quietly undervalued or if today’s price already reflects all that future growth potential.
Advertisement
Price-to-Earnings of 9.1x: Is it justified?
At ¥1,702, Zeon is trading at a price-to-earnings (P/E) ratio of 9.1x. This signals the market is valuing its shares below both peer and industry averages.
The P/E ratio measures what investors are willing to pay per unit of earnings. For Zeon, this low multiple could reflect skepticism about its future growth or confidence that current earnings are sustainable. In the chemicals sector, where earnings can be cyclical, a low P/E sometimes points to perceived uncertainty but can also represent opportunity if outlooks improve.
Compared to the JP Chemicals industry average P/E of 12.3x and a peer average of 25.8x, Zeon's valuation stands out as a bargain. Our estimate of Zeon's fair P/E is 12.8x. This suggests the market could re-rate the stock upward if fundamentals remain supportive.
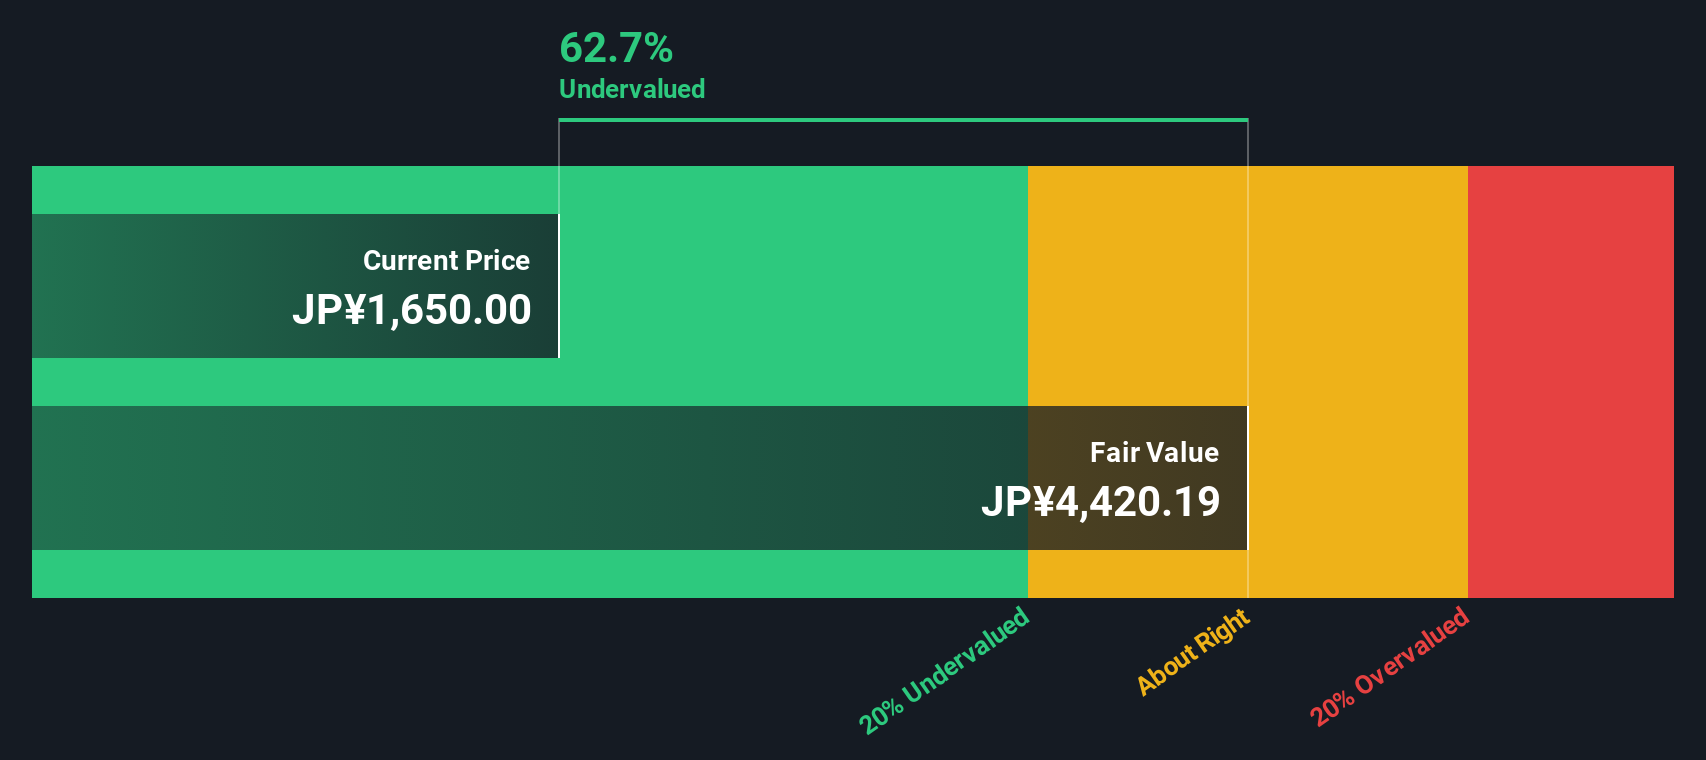
Taking a different perspective, our SWS DCF model suggests Zeon is trading well below its estimated fair value. The model indicates an implied fair value of ¥4,888 per share compared to the current price of ¥1,702. This points to significant potential undervaluation in the market’s eyes. Could the DCF outlook be too optimistic, or is there an opportunity lurking beneath the surface?
Simply Wall St performs a discounted cash flow (DCF) on every stock in the world every day (check out Zeon for example). We show the entire calculation in full. You can track the result in your watchlist or portfolio and be alerted when this changes, or use our stock screener to discover 927 undervalued stocks based on their cash flows. If you save a screener we even alert you when new companies match - so you never miss a potential opportunity.
Build Your Own Zeon Narrative
If you’d like to dig into Zeon's story and see the data from your own perspective, you can craft your own narrative in just minutes. Do it your way
Catch the next big wave in tech by reviewing these 26 AI penny stocks. These offer the innovation and performance to shape tomorrow’s markets.
This article by Simply Wall St is general in nature. We provide commentary based on historical data
and analyst forecasts only using an unbiased methodology and our articles are not intended to be financial advice. It does not constitute a recommendation to buy or sell any stock, and does not take account of your objectives, or your
financial situation. We aim to bring you long-term focused analysis driven by fundamental data.
Note that our analysis may not factor in the latest price-sensitive company announcements or qualitative material.
Simply Wall St has no position in any stocks mentioned.
Valuation is complex, but we're here to simplify it.
Discover if Zeon might be undervalued or overvalued with our detailed analysis, featuring fair value estimates, potential risks, dividends, insider trades, and its financial condition.