Advertisement
Assessing Shin-Etsu Chemical’s (TSE:4063) Valuation Following Dividend Affirmation and Fresh Financial Guidance

Simply Wall St
Reviewed by Simply Wall St
Shin-Etsu Chemical (TSE:4063) just affirmed its dividend payout for the coming fiscal year and released fresh earnings guidance. This move highlights the company’s continued focus on delivering value to shareholders.
See our latest analysis for Shin-Etsu Chemical.
Shin-Etsu Chemical’s latest dividend affirmation and earnings outlook come after a bumpy year, with the share price retreating 10.5% year-to-date but staging a nearly 7% rebound in the last 90 days. While the 1-year total shareholder return sits at -14.3%, the long-term picture remains strong with a 60.9% gain over three years. This reflects resilience and ongoing growth despite recent volatility.
If steady dividend payouts and resilient industry leaders are on your radar, it’s a smart time to broaden your search and discover fast growing stocks with high insider ownership
With fresh dividends and guidance now on the table, the key question for investors is whether Shin-Etsu Chemical’s recent share recovery signals an undervalued opportunity or if the market has already accounted for future growth prospects.
Price-to-Earnings of 17.6x: Is it justified?
Shin-Etsu Chemical currently trades on a price-to-earnings (P/E) multiple of 17.6x, putting it above the industry average. At a last close of ¥4,668, this implies investors are paying a premium for future earnings compared to other chemical companies in Japan.
The price-to-earnings ratio is a key measure of how much the market values each yen of a company’s earnings. For established materials companies like Shin-Etsu, it captures sentiment around recent profit performance and future growth potential.
Shin-Etsu Chemical's P/E ratio of 17.6x looks expensive versus the Japanese chemicals industry average of 13x. Against the peer group, however, its valuation appears more attractive, with the peer average standing at 20.9x. Notably, compared to the estimated fair P/E ratio of 23.3x, Shin-Etsu Chemical is trading at a significant discount. This is a level the market could move toward if investor optimism returns.
Explore the SWS fair ratio for Shin-Etsu Chemical
Result: Price-to-Earnings of 17.6x (ABOUT RIGHT)
However, continued volatility in global chemicals demand and unexpected shifts in industry regulation could present headwinds, even with the company's recent momentum.
Find out about the key risks to this Shin-Etsu Chemical narrative.
Another View: DCF Model Paints a Different Picture
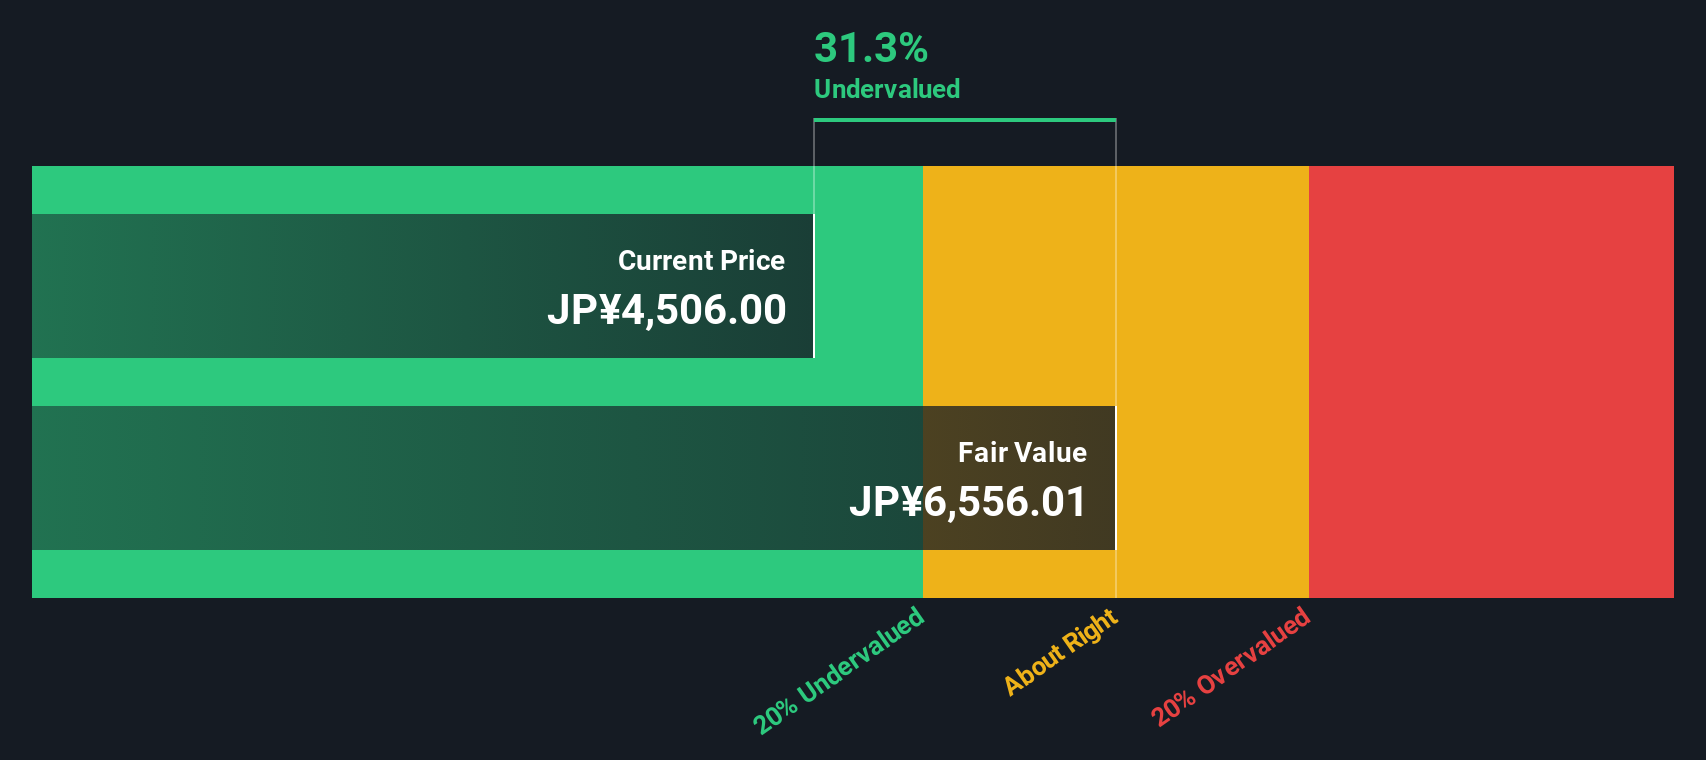
While the market is pricing Shin-Etsu Chemical slightly high on earnings, our DCF model suggests a different story. According to the SWS DCF model, shares are trading about 27% below estimated fair value. This points to clear undervaluation. Could market sentiment be missing hidden potential?
Look into how the SWS DCF model arrives at its fair value.
Simply Wall St performs a discounted cash flow (DCF) on every stock in the world every day (check out Shin-Etsu Chemical for example). We show the entire calculation in full. You can track the result in your watchlist or portfolio and be alerted when this changes, or use our stock screener to discover 831 undervalued stocks based on their cash flows. If you save a screener we even alert you when new companies match - so you never miss a potential opportunity.
Build Your Own Shin-Etsu Chemical Narrative
For those who like to dig deeper or form their own conclusions, you can analyze the numbers and quickly craft your own perspective in just a few minutes. Do it your way
A great starting point for your Shin-Etsu Chemical research is our analysis highlighting 2 key rewards and 1 important warning sign that could impact your investment decision.
Looking for More Smart Investment Opportunities?
Smart investors know that the right screener can reveal tomorrow’s winners today, and Simply Wall Street offers powerful tools you can act on now.
- Uncover growth potential by tracking these 831 undervalued stocks based on cash flows, which are primed for strong returns on solid fundamentals.
- Spot emerging trends in technology by checking out these 26 AI penny stocks, as these are reshaping industries through innovation and real-world impact.
- Boost your passive income potential by reviewing these 24 dividend stocks with yields > 3%, which consistently deliver attractive yields and robust balance sheets.
This article by Simply Wall St is general in nature. We provide commentary based on historical data and analyst forecasts only using an unbiased methodology and our articles are not intended to be financial advice. It does not constitute a recommendation to buy or sell any stock, and does not take account of your objectives, or your financial situation. We aim to bring you long-term focused analysis driven by fundamental data. Note that our analysis may not factor in the latest price-sensitive company announcements or qualitative material. Simply Wall St has no position in any stocks mentioned.
New: Manage All Your Stock Portfolios in One Place
We've created the ultimate portfolio companion for stock investors, and it's free.
• Connect an unlimited number of Portfolios and see your total in one currency
• Be alerted to new Warning Signs or Risks via email or mobile
• Track the Fair Value of your stocks
Have feedback on this article? Concerned about the content? Get in touch with us directly. Alternatively, email editorial-team@simplywallst.com
About TSE:4063
Shin-Etsu Chemical
Provides infrastructure, electronics, and functional materials in Japan.
Excellent balance sheet, good value and pays a dividend.
Similar Companies
Market Insights

Advertisement
Community Narratives
The company that turned a verb into a global necessity and basically runs the modern internet, digital ads, smartphones, maps, and AI.
Fair Value US$300.00|6.2% undervalued
OS
Community Contributor
Flowers Foods Pays A Fair Price For Health
Fair Value US$16.12|25.1% undervalued
NV
Community Contributor
TMX Group will thrive with 33.3% profit margin and enduring market moat
Fair Value CA$49.90|0.04% overvalued
LI
Community Contributor