Are Robust Financials Driving The Recent Rally In MS&AD Insurance Group Holdings, Inc.'s (TSE:8725) Stock?


MS&AD Insurance Group Holdings' (TSE:8725) stock is up by a considerable 9.0% over the past month. Given that the market rewards strong financials in the long-term, we wonder if that is the case in this instance. Particularly, we will be paying attention to MS&AD Insurance Group Holdings' ROE today.
Return on equity or ROE is a key measure used to assess how efficiently a company's management is utilizing the company's capital. In simpler terms, it measures the profitability of a company in relation to shareholder's equity.
Check out our latest analysis for MS&AD Insurance Group Holdings
How Is ROE Calculated?
Return on equity can be calculated by using the formula:
Return on Equity = Net Profit (from continuing operations) ÷ Shareholders' Equity
So, based on the above formula, the ROE for MS&AD Insurance Group Holdings is:
10% = JP¥466b ÷ JP¥4.6t (Based on the trailing twelve months to June 2024).
The 'return' is the income the business earned over the last year. So, this means that for every ¥1 of its shareholder's investments, the company generates a profit of ¥0.10.
What Has ROE Got To Do With Earnings Growth?
So far, we've learned that ROE is a measure of a company's profitability. Depending on how much of these profits the company reinvests or "retains", and how effectively it does so, we are then able to assess a company’s earnings growth potential. Assuming all else is equal, companies that have both a higher return on equity and higher profit retention are usually the ones that have a higher growth rate when compared to companies that don't have the same features.
MS&AD Insurance Group Holdings' Earnings Growth And 10% ROE
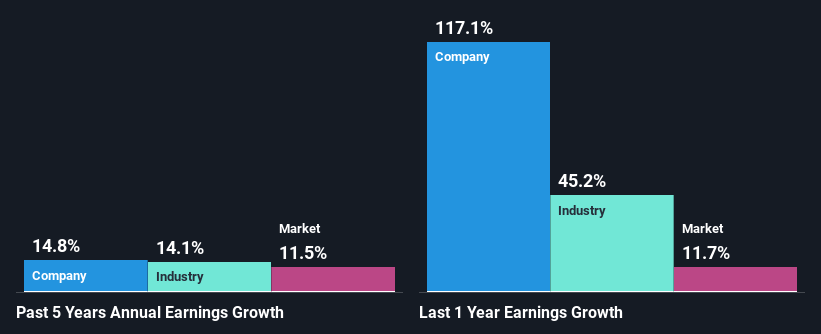
To start with, MS&AD Insurance Group Holdings' ROE looks acceptable. Further, the company's ROE is similar to the industry average of 10%. This probably goes some way in explaining MS&AD Insurance Group Holdings' moderate 15% growth over the past five years amongst other factors.
As a next step, we compared MS&AD Insurance Group Holdings' net income growth with the industry and found that the company has a similar growth figure when compared with the industry average growth rate of 14% in the same period.
Earnings growth is an important metric to consider when valuing a stock. It’s important for an investor to know whether the market has priced in the company's expected earnings growth (or decline). Doing so will help them establish if the stock's future looks promising or ominous. Is MS&AD Insurance Group Holdings fairly valued compared to other companies? These 3 valuation measures might help you decide.
Is MS&AD Insurance Group Holdings Efficiently Re-investing Its Profits?
While MS&AD Insurance Group Holdings has a three-year median payout ratio of 52% (which means it retains 48% of profits), the company has still seen a fair bit of earnings growth in the past, meaning that its high payout ratio hasn't hampered its ability to grow.
Moreover, MS&AD Insurance Group Holdings is determined to keep sharing its profits with shareholders which we infer from its long history of paying a dividend for at least ten years.
Summary
On the whole, we feel that MS&AD Insurance Group Holdings' performance has been quite good. Especially the high ROE, Which has contributed to the impressive growth seen in earnings. Despite the company reinvesting only a small portion of its profits, it still has managed to grow its earnings so that is appreciable. That being so, a study of the latest analyst forecasts show that the company is expected to see a slowdown in its future earnings growth. To know more about the latest analysts predictions for the company, check out this visualization of analyst forecasts for the company.
New: Manage All Your Stock Portfolios in One Place
We've created the ultimate portfolio companion for stock investors, and it's free.
• Connect an unlimited number of Portfolios and see your total in one currency
• Be alerted to new Warning Signs or Risks via email or mobile
• Track the Fair Value of your stocks
Have feedback on this article? Concerned about the content? Get in touch with us directly. Alternatively, email editorial-team (at) simplywallst.com.
This article by Simply Wall St is general in nature. We provide commentary based on historical data and analyst forecasts only using an unbiased methodology and our articles are not intended to be financial advice. It does not constitute a recommendation to buy or sell any stock, and does not take account of your objectives, or your financial situation. We aim to bring you long-term focused analysis driven by fundamental data. Note that our analysis may not factor in the latest price-sensitive company announcements or qualitative material. Simply Wall St has no position in any stocks mentioned.
About TSE:8725
MS&AD Insurance Group Holdings
An insurance holding company, provides insurance and financial services worldwide.
Solid track record with excellent balance sheet and pays a dividend.
