- Japan
- /
- Personal Products
- /
- TSE:5194
Investors five-year losses continue as Sagami Rubber Industries (TSE:5194) dips a further 19% this week, earnings continue to decline


In order to justify the effort of selecting individual stocks, it's worth striving to beat the returns from a market index fund. But every investor is virtually certain to have both over-performing and under-performing stocks. At this point some shareholders may be questioning their investment in Sagami Rubber Industries Co., Ltd. (TSE:5194), since the last five years saw the share price fall 48%. Even worse, it's down 20% in about a month, which isn't fun at all. However, we note the price may have been impacted by the broader market, which is down 22% in the same time period.
Since Sagami Rubber Industries has shed JP¥2.1b from its value in the past 7 days, let's see if the longer term decline has been driven by the business' economics.
View our latest analysis for Sagami Rubber Industries
In his essay The Superinvestors of Graham-and-Doddsville Warren Buffett described how share prices do not always rationally reflect the value of a business. One way to examine how market sentiment has changed over time is to look at the interaction between a company's share price and its earnings per share (EPS).
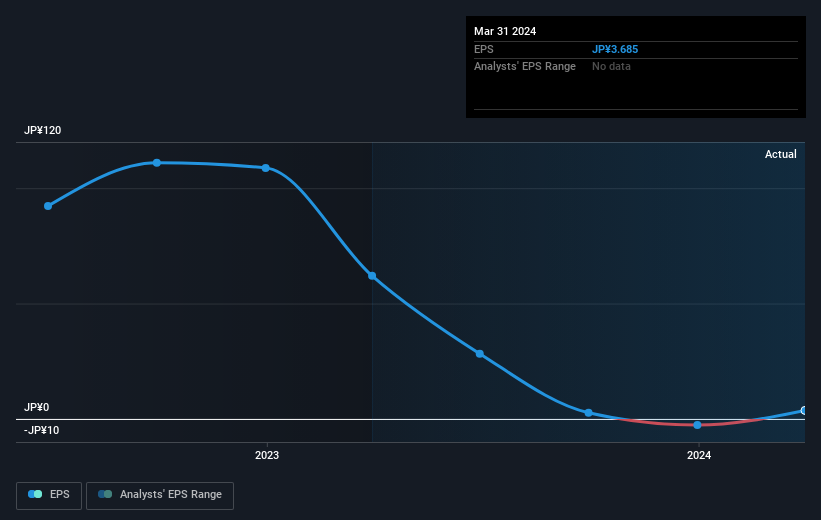
Looking back five years, both Sagami Rubber Industries' share price and EPS declined; the latter at a rate of 41% per year. This was, in part, due to extraordinary items impacting earnings. This fall in the EPS is worse than the 12% compound annual share price fall. The relatively muted share price reaction might be because the market expects the business to turn around. The high P/E ratio of 216.32 suggests that shareholders believe earnings will grow in the years ahead.
You can see below how EPS has changed over time (discover the exact values by clicking on the image).
Before buying or selling a stock, we always recommend a close examination of historic growth trends, available here.
What About Dividends?
When looking at investment returns, it is important to consider the difference between total shareholder return (TSR) and share price return. Whereas the share price return only reflects the change in the share price, the TSR includes the value of dividends (assuming they were reinvested) and the benefit of any discounted capital raising or spin-off. Arguably, the TSR gives a more comprehensive picture of the return generated by a stock. We note that for Sagami Rubber Industries the TSR over the last 5 years was -46%, which is better than the share price return mentioned above. The dividends paid by the company have thusly boosted the total shareholder return.
A Different Perspective
It's good to see that Sagami Rubber Industries has rewarded shareholders with a total shareholder return of 5.4% in the last twelve months. And that does include the dividend. There's no doubt those recent returns are much better than the TSR loss of 8% per year over five years. This makes us a little wary, but the business might have turned around its fortunes. While it is well worth considering the different impacts that market conditions can have on the share price, there are other factors that are even more important. Like risks, for instance. Every company has them, and we've spotted 5 warning signs for Sagami Rubber Industries (of which 2 can't be ignored!) you should know about.
If you are like me, then you will not want to miss this free list of undervalued small caps that insiders are buying.
Please note, the market returns quoted in this article reflect the market weighted average returns of stocks that currently trade on Japanese exchanges.
New: Manage All Your Stock Portfolios in One Place
We've created the ultimate portfolio companion for stock investors, and it's free.
• Connect an unlimited number of Portfolios and see your total in one currency
• Be alerted to new Warning Signs or Risks via email or mobile
• Track the Fair Value of your stocks
Have feedback on this article? Concerned about the content? Get in touch with us directly. Alternatively, email editorial-team (at) simplywallst.com.
This article by Simply Wall St is general in nature. We provide commentary based on historical data and analyst forecasts only using an unbiased methodology and our articles are not intended to be financial advice. It does not constitute a recommendation to buy or sell any stock, and does not take account of your objectives, or your financial situation. We aim to bring you long-term focused analysis driven by fundamental data. Note that our analysis may not factor in the latest price-sensitive company announcements or qualitative material. Simply Wall St has no position in any stocks mentioned.
Have feedback on this article? Concerned about the content? Get in touch with us directly. Alternatively, email editorial-team@simplywallst.com
About TSE:5194
Slight with mediocre balance sheet.
