
Advertisement
- Japan
- /
- Healthcare Services
- /
- TSE:8129
Are Robust Financials Driving The Recent Rally In Toho Holdings Co., Ltd.'s (TSE:8129) Stock?
Toho Holdings (TSE:8129) has had a great run on the share market with its stock up by a significant 10% over the last three months. Given that the market rewards strong financials in the long-term, we wonder if that is the case in this instance. Specifically, we decided to study Toho Holdings' ROE in this article.
Return on equity or ROE is a key measure used to assess how efficiently a company's management is utilizing the company's capital. Put another way, it reveals the company's success at turning shareholder investments into profits.
Check out our latest analysis for Toho Holdings
How Is ROE Calculated?
The formula for ROE is:
Return on Equity = Net Profit (from continuing operations) ÷ Shareholders' Equity
So, based on the above formula, the ROE for Toho Holdings is:
8.4% = JP¥21b ÷ JP¥250b (Based on the trailing twelve months to June 2024).
The 'return' is the yearly profit. So, this means that for every ¥1 of its shareholder's investments, the company generates a profit of ¥0.08.
What Is The Relationship Between ROE And Earnings Growth?
We have already established that ROE serves as an efficient profit-generating gauge for a company's future earnings. Based on how much of its profits the company chooses to reinvest or "retain", we are then able to evaluate a company's future ability to generate profits. Generally speaking, other things being equal, firms with a high return on equity and profit retention, have a higher growth rate than firms that don’t share these attributes.
Toho Holdings' Earnings Growth And 8.4% ROE
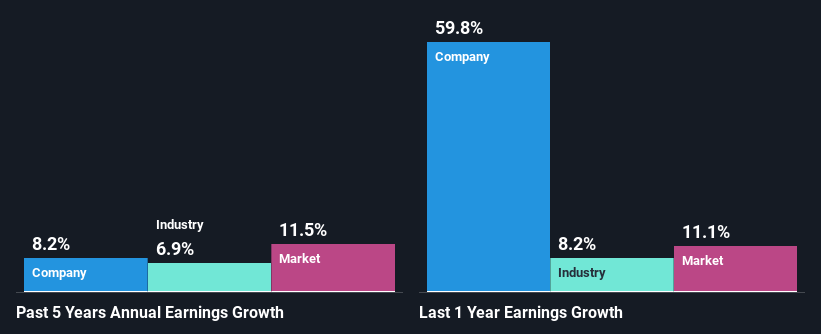
To start with, Toho Holdings' ROE looks acceptable. Further, the company's ROE is similar to the industry average of 10%. Consequently, this likely laid the ground for the decent growth of 8.2% seen over the past five years by Toho Holdings.
Next, on comparing Toho Holdings' net income growth with the industry, we found that the company's reported growth is similar to the industry average growth rate of 6.9% over the last few years.
The basis for attaching value to a company is, to a great extent, tied to its earnings growth. It’s important for an investor to know whether the market has priced in the company's expected earnings growth (or decline). This then helps them determine if the stock is placed for a bright or bleak future. If you're wondering about Toho Holdings''s valuation, check out this gauge of its price-to-earnings ratio, as compared to its industry.
Is Toho Holdings Making Efficient Use Of Its Profits?
Toho Holdings has a low three-year median payout ratio of 16%, meaning that the company retains the remaining 84% of its profits. This suggests that the management is reinvesting most of the profits to grow the business.
Moreover, Toho Holdings is determined to keep sharing its profits with shareholders which we infer from its long history of paying a dividend for at least ten years.
Conclusion
In total, we are pretty happy with Toho Holdings' performance. In particular, it's great to see that the company is investing heavily into its business and along with a high rate of return, that has resulted in a sizeable growth in its earnings. That being so, a study of the latest analyst forecasts show that the company is expected to see a slowdown in its future earnings growth. To know more about the company's future earnings growth forecasts take a look at this free report on analyst forecasts for the company to find out more.
Valuation is complex, but we're here to simplify it.
Discover if Toho Holdings might be undervalued or overvalued with our detailed analysis, featuring fair value estimates, potential risks, dividends, insider trades, and its financial condition.
Access Free AnalysisHave feedback on this article? Concerned about the content? Get in touch with us directly. Alternatively, email editorial-team (at) simplywallst.com.
This article by Simply Wall St is general in nature. We provide commentary based on historical data and analyst forecasts only using an unbiased methodology and our articles are not intended to be financial advice. It does not constitute a recommendation to buy or sell any stock, and does not take account of your objectives, or your financial situation. We aim to bring you long-term focused analysis driven by fundamental data. Note that our analysis may not factor in the latest price-sensitive company announcements or qualitative material. Simply Wall St has no position in any stocks mentioned.
About TSE:8129
Toho Holdings
Engages in the wholesale distribution of pharmaceutical products in Japan.
Flawless balance sheet and undervalued.
Market Insights

Advertisement
Community Narratives
MicroVision will explode future revenue by 380.37% with a vision towards success
Fair Value US$60.00|98.4% undervalued
TH
Community Contributor
The Indispensable Artery for a New North American Economy
Fair Value CA$132.87|1.3% undervalued
TI
Community Contributor