Stock Analysis
Kikkoman Corporation's (TSE:2801) Stock Has Been Sliding But Fundamentals Look Strong: Is The Market Wrong?


It is hard to get excited after looking at Kikkoman's (TSE:2801) recent performance, when its stock has declined 5.0% over the past three months. However, a closer look at its sound financials might cause you to think again. Given that fundamentals usually drive long-term market outcomes, the company is worth looking at. In this article, we decided to focus on Kikkoman's ROE.
ROE or return on equity is a useful tool to assess how effectively a company can generate returns on the investment it received from its shareholders. In short, ROE shows the profit each dollar generates with respect to its shareholder investments.
View our latest analysis for Kikkoman
How Is ROE Calculated?
ROE can be calculated by using the formula:
Return on Equity = Net Profit (from continuing operations) ÷ Shareholders' Equity
So, based on the above formula, the ROE for Kikkoman is:
11% = JP¥57b ÷ JP¥498b (Based on the trailing twelve months to March 2024).
The 'return' is the yearly profit. One way to conceptualize this is that for each ¥1 of shareholders' capital it has, the company made ¥0.11 in profit.
What Is The Relationship Between ROE And Earnings Growth?
Thus far, we have learned that ROE measures how efficiently a company is generating its profits. Based on how much of its profits the company chooses to reinvest or "retain", we are then able to evaluate a company's future ability to generate profits. Assuming all else is equal, companies that have both a higher return on equity and higher profit retention are usually the ones that have a higher growth rate when compared to companies that don't have the same features.
A Side By Side comparison of Kikkoman's Earnings Growth And 11% ROE
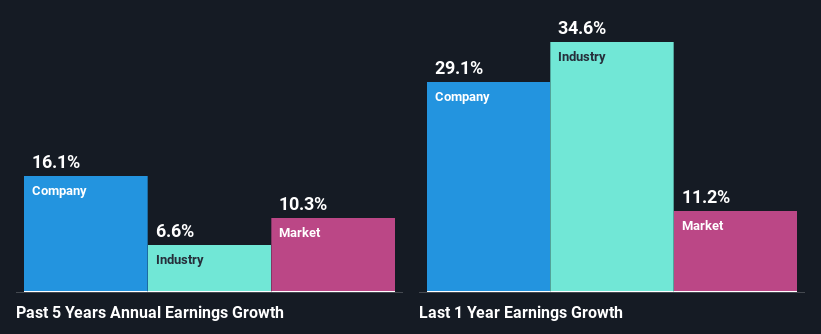
To begin with, Kikkoman seems to have a respectable ROE. Especially when compared to the industry average of 7.7% the company's ROE looks pretty impressive. This probably laid the ground for Kikkoman's moderate 16% net income growth seen over the past five years.
As a next step, we compared Kikkoman's net income growth with the industry, and pleasingly, we found that the growth seen by the company is higher than the average industry growth of 6.6%.
Earnings growth is a huge factor in stock valuation. The investor should try to establish if the expected growth or decline in earnings, whichever the case may be, is priced in. This then helps them determine if the stock is placed for a bright or bleak future. If you're wondering about Kikkoman's's valuation, check out this gauge of its price-to-earnings ratio, as compared to its industry.
Is Kikkoman Efficiently Re-investing Its Profits?
Kikkoman has a three-year median payout ratio of 30%, which implies that it retains the remaining 70% of its profits. This suggests that its dividend is well covered, and given the decent growth seen by the company, it looks like management is reinvesting its earnings efficiently.
Additionally, Kikkoman has paid dividends over a period of at least ten years which means that the company is pretty serious about sharing its profits with shareholders.
Conclusion
In total, we are pretty happy with Kikkoman's performance. Specifically, we like that the company is reinvesting a huge chunk of its profits at a high rate of return. This of course has caused the company to see substantial growth in its earnings. Having said that, the company's earnings growth is expected to slow down, as forecasted in the current analyst estimates. To know more about the company's future earnings growth forecasts take a look at this free report on analyst forecasts for the company to find out more.
Valuation is complex, but we're helping make it simple.
Find out whether Kikkoman is potentially over or undervalued by checking out our comprehensive analysis, which includes fair value estimates, risks and warnings, dividends, insider transactions and financial health.
View the Free AnalysisHave feedback on this article? Concerned about the content? Get in touch with us directly. Alternatively, email editorial-team (at) simplywallst.com.
This article by Simply Wall St is general in nature. We provide commentary based on historical data and analyst forecasts only using an unbiased methodology and our articles are not intended to be financial advice. It does not constitute a recommendation to buy or sell any stock, and does not take account of your objectives, or your financial situation. We aim to bring you long-term focused analysis driven by fundamental data. Note that our analysis may not factor in the latest price-sensitive company announcements or qualitative material. Simply Wall St has no position in any stocks mentioned.
Valuation is complex, but we're helping make it simple.
Find out whether Kikkoman is potentially over or undervalued by checking out our comprehensive analysis, which includes fair value estimates, risks and warnings, dividends, insider transactions and financial health.
View the Free AnalysisHave feedback on this article? Concerned about the content? Get in touch with us directly. Alternatively, email editorial-team@simplywallst.com
About TSE:2801
Kikkoman
Through its subsidiaries, manufactures and sells food products in Japan and internationally.
Flawless balance sheet with proven track record and pays a dividend.
