Advertisement
Morinaga (TSE:2201) Lifts Forecast—What Does the Upgraded Guidance Mean for Its Current Valuation?

Simply Wall St
Reviewed by Simply Wall St
Morinaga&Co (TSE:2201) has just raised its full-year earnings forecast after the first half outperformed profit expectations. This was due to a combination of solid confectionery sales, price adjustments, and easing input costs.
See our latest analysis for Morinaga&Co.
Morinaga&Co’s recent string of upbeat announcements, including an upgraded full-year earnings forecast and a move to semiannual dividends, has helped restore some positive sentiment around the stock. While short-term share price moves have been fairly muted, with a year-to-date decline of 1.6%, long-term investors have been rewarded with a 1-year total shareholder return of 2.35% and a three-year total return of 51.5%. This strong showing reflects the company’s steady growth and improved profitability.
If steady performance and business turnarounds interest you, it could be the perfect moment to broaden your search and discover fast growing stocks with high insider ownership
With upgraded guidance and improving profits, investors now face a key question: is Morinaga&Co still trading at an attractive discount, or are future gains already reflected in today’s price?
Price-to-Earnings of 12.4x: Is it justified?
Morinaga&Co’s shares trade at a price-to-earnings (P/E) ratio of just 12.4, standing out as attractively priced compared to both peers and the industry average. With the last close at ¥2672, investors see a clear discount relative to valuation benchmarks.
The P/E ratio measures how much investors are willing to pay per yen of company earnings. It is one of the simplest ways to gauge value, especially for established companies with steady profits like Morinaga&Co. A lower P/E often suggests investors expect slower future growth or see greater risks, but it can also flag an undervalued opportunity if earnings quality is strong.
Morinaga&Co’s 12.4x P/E is compelling not only against the peer average of 14.8x but also versus the Japanese Food industry average of 16.4x. This highlights a steep relative discount. Based on regression analysis, a “fair” P/E for the company is estimated to be 15.7x, suggesting notable room for upward re-rating if investor sentiment catches up to earnings fundamentals.
Explore the SWS fair ratio for Morinaga&Co
Result: Price-to-Earnings of 12.4x (UNDERVALUED)
However, softer short-term share price momentum and the risk of slower industry growth could temper the bullish case for Morinaga&Co’s current valuation.
Find out about the key risks to this Morinaga&Co narrative.
Another View: What Does the DCF Model Say?
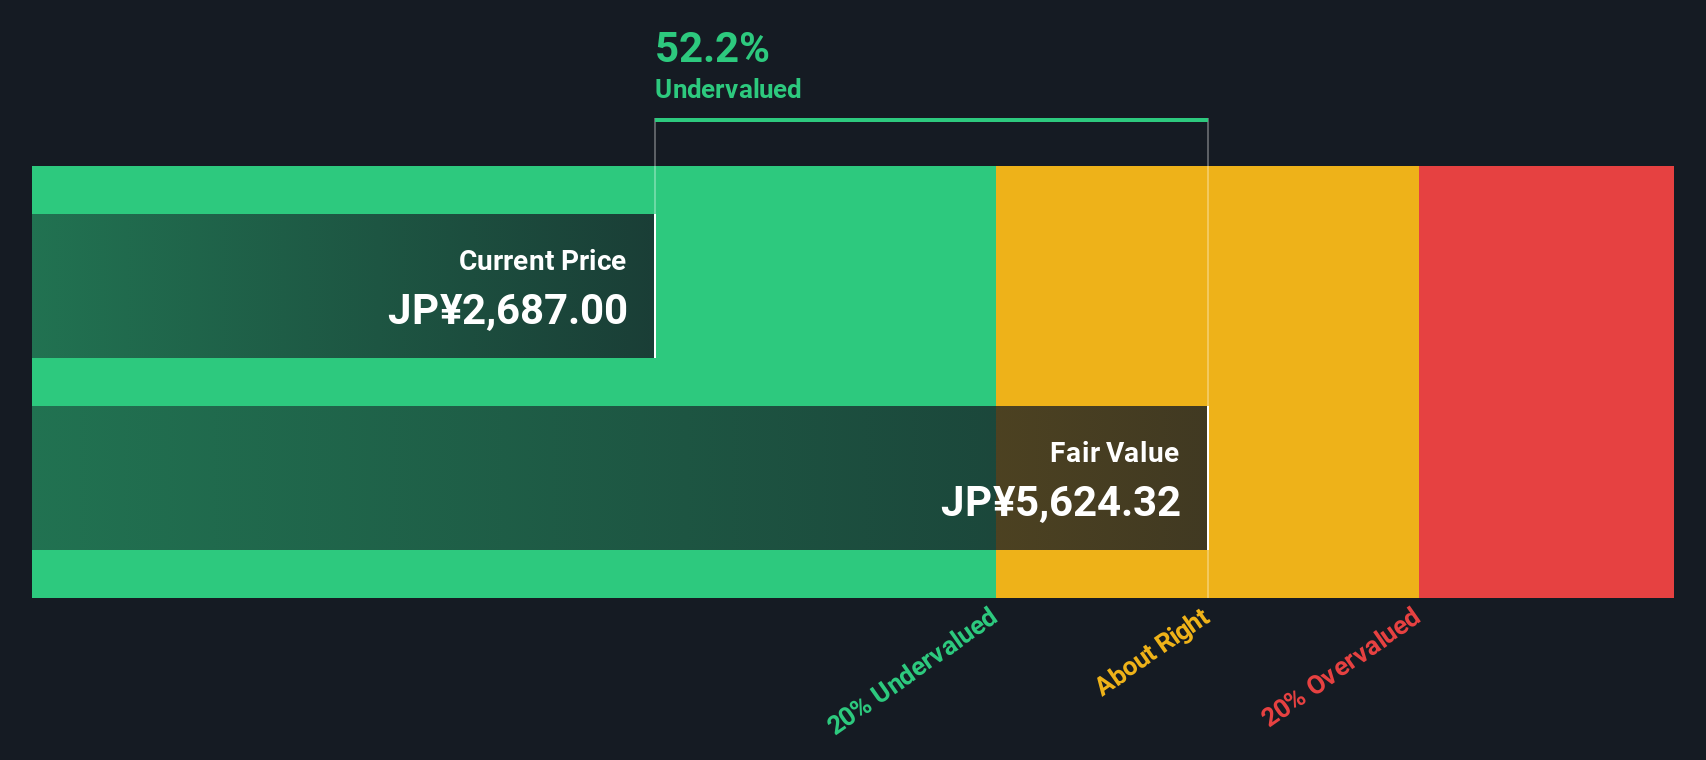
Taking a different angle, our SWS DCF model suggests Morinaga&Co could be even more undervalued than it appears on earnings multiples alone. At ¥2672, the stock trades at more than 50% below the DCF estimate of fair value. This highlights significant potential upside if long-term cash flows are realized. Could this gap signal an opportunity, or are expectations running ahead of reality?
Look into how the SWS DCF model arrives at its fair value.
Simply Wall St performs a discounted cash flow (DCF) on every stock in the world every day (check out Morinaga&Co for example). We show the entire calculation in full. You can track the result in your watchlist or portfolio and be alerted when this changes, or use our stock screener to discover 927 undervalued stocks based on their cash flows. If you save a screener we even alert you when new companies match - so you never miss a potential opportunity.
Build Your Own Morinaga&Co Narrative
If you see things differently or want to dig deeper into the numbers yourself, you can easily craft your own perspective in just a few minutes. Do it your way
A great starting point for your Morinaga&Co research is our analysis highlighting 4 key rewards and 1 important warning sign that could impact your investment decision.
Looking for More Winning Investment Ideas?
Don’t limit your portfolio. Take charge and discover emerging opportunities other investors may be missing. The Simply Wall Street Screener puts powerful stock ideas at your fingertips:
- Boost your income by targeting these 15 dividend stocks with yields > 3% that consistently pay yields above 3%, ensuring your money works harder for you.
- Unleash your growth potential with these 927 undervalued stocks based on cash flows based on solid cash flows and value metrics, offering hidden gems at compelling prices.
- Catalyze your exposure to future technology trends by tapping into these 26 AI penny stocks shaping the artificial intelligence wave.
This article by Simply Wall St is general in nature. We provide commentary based on historical data and analyst forecasts only using an unbiased methodology and our articles are not intended to be financial advice. It does not constitute a recommendation to buy or sell any stock, and does not take account of your objectives, or your financial situation. We aim to bring you long-term focused analysis driven by fundamental data. Note that our analysis may not factor in the latest price-sensitive company announcements or qualitative material. Simply Wall St has no position in any stocks mentioned.
New: Manage All Your Stock Portfolios in One Place
We've created the ultimate portfolio companion for stock investors, and it's free.
• Connect an unlimited number of Portfolios and see your total in one currency
• Be alerted to new Warning Signs or Risks via email or mobile
• Track the Fair Value of your stocks
Have feedback on this article? Concerned about the content? Get in touch with us directly. Alternatively, email editorial-team@simplywallst.com
About TSE:2201
Morinaga&Co
Manufactures, purchases, and sells confectionaries, food, frozen desserts, and health products in Japan and internationally.
Undervalued with solid track record and pays a dividend.
Similar Companies
Market Insights

Advertisement
Community Narratives
MicroVision will explode future revenue by 380.37% with a vision towards success
Fair Value US$60.00|98.4% undervalued
TH
Community Contributor
The Indispensable Artery for a New North American Economy
Fair Value CA$132.87|1.3% undervalued
TI
Community Contributor