Advertisement
- Japan
- /
- Oil and Gas
- /
- TSE:8088
Iwatani (TSE:8088): Valuation Insights Following Interim Dividend and Strong Net Income Growth

Simply Wall St
Reviewed by Simply Wall St
Iwatani (TSE:8088) just announced an interim dividend alongside its latest financial results, highlighting a 2% rise in net sales and a noteworthy 51% jump in net income for the recent six-month period. The company is maintaining its annual outlook and continues its focus on steady shareholder returns.
See our latest analysis for Iwatani.
Iwatani’s share price has seen a modest recovery in recent weeks, rising 2.3% over the past seven days and 4.7% over the past three months. However, 2024 has been challenging with a 6.1% year-to-date share price return and a one-year total shareholder return of -13%. Its longer-term record remains strong, with 27% and 42% total shareholder returns over three and five years. This suggests that momentum could be building again as recent earnings and dividends underpin renewed investor interest.
If news of Iwatani’s latest payout has you curious, this could be the right moment to broaden your search and discover fast growing stocks with high insider ownership
With solid long-term gains but recent volatility, is Iwatani’s current valuation a chance for investors to buy into future growth, or has the market already priced in all the company’s strengths?
Price-to-Earnings of 10.9x: Is it justified?
With Iwatani trading on a price-to-earnings (P/E) ratio of 10.9x, the stock appears attractively valued compared to its immediate peer group. The most recent closing price of ¥1663.5 places it below both the industry and market averages for this metric.
The P/E ratio is a classic benchmark that tells investors how much they are paying for each unit of earnings. For a diversified energy company like Iwatani, a lower ratio can suggest that investors are either underestimating its earnings power or pricing in downside risk relative to peers.
When viewed alongside the Asian Oil and Gas industry’s average P/E of 13.5x, Iwatani’s shares are selling at a clear discount. In addition, the market’s estimated fair price-to-earnings ratio is materially higher at 16.7x, suggesting that valuations could rerate upward if expectations strengthen in the coming periods.
Explore the SWS fair ratio for Iwatani
Result: Price-to-Earnings of 10.9x (UNDERVALUED)
However, ongoing share price volatility and broader market uncertainties could temper the optimism around Iwatani's attractive valuation in the near term.
Find out about the key risks to this Iwatani narrative.
Another View: The SWS DCF Model
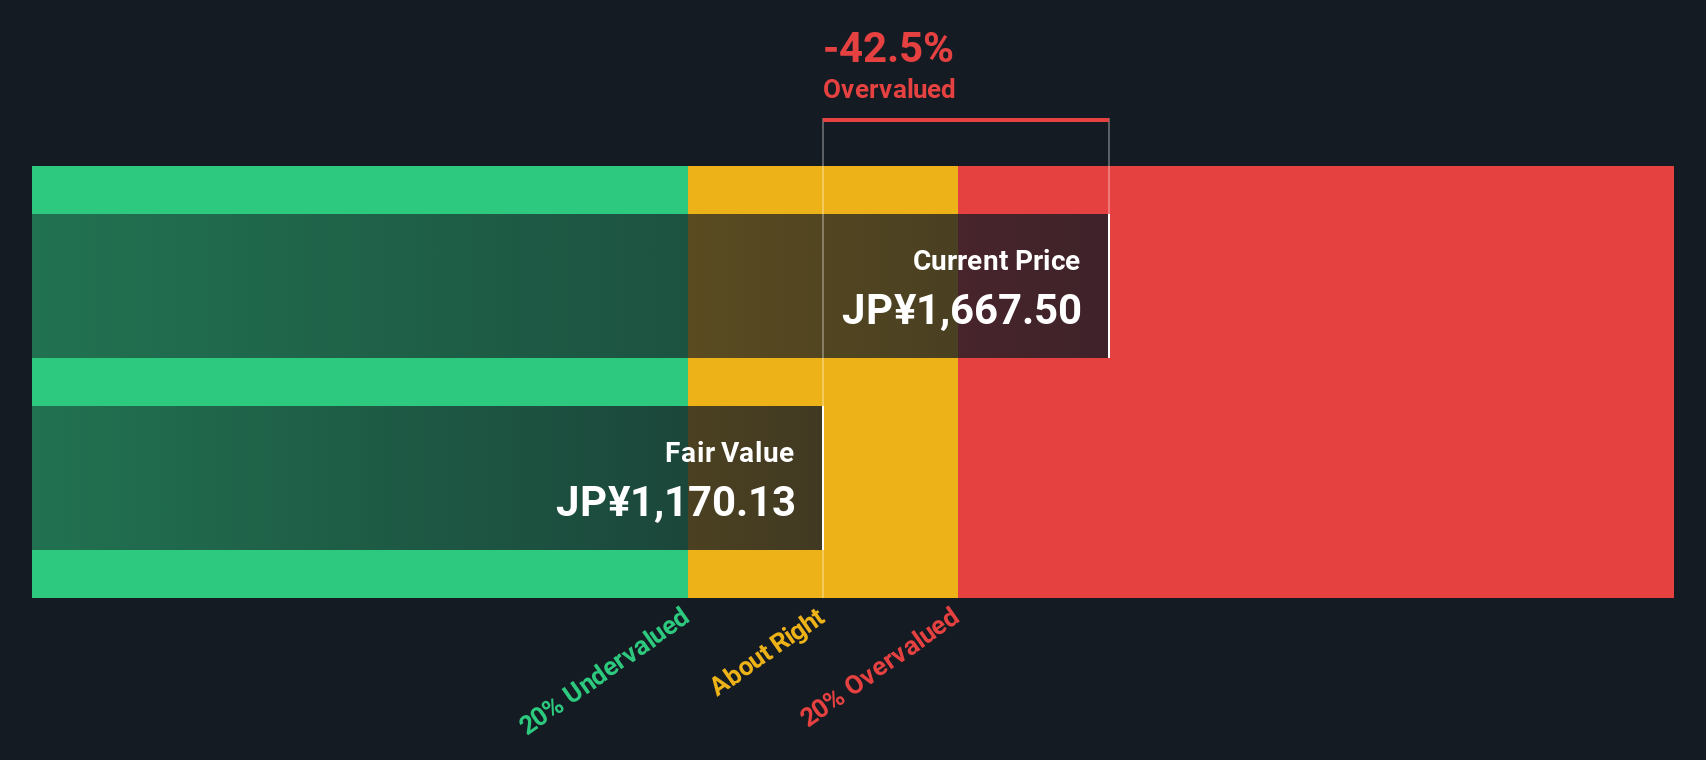
While multiples suggest Iwatani is undervalued, our DCF model tells a different story. Based on discounted future cash flows, the SWS DCF model estimates a fair value of ¥1171 per share, which is about 30% below the current price. This points to possible overvaluation if cash flow projections turn out to be accurate. So which metric will steer the market next?
Look into how the SWS DCF model arrives at its fair value.
Simply Wall St performs a discounted cash flow (DCF) on every stock in the world every day (check out Iwatani for example). We show the entire calculation in full. You can track the result in your watchlist or portfolio and be alerted when this changes, or use our stock screener to discover 865 undervalued stocks based on their cash flows. If you save a screener we even alert you when new companies match - so you never miss a potential opportunity.
Build Your Own Iwatani Narrative
If you have another perspective or want to dig into the numbers yourself, you can easily build your own view in just a few minutes. Do it your way
A great starting point for your Iwatani research is our analysis highlighting 3 key rewards and 3 important warning signs that could impact your investment decision.
Looking for more investment ideas?
Don't limit your opportunities to just one company. Smart investors regularly scan new market segments. The right screener could uncover your next big winner.
- Kickstart your hunt for promising market disruptors with these 865 undervalued stocks based on cash flows which are trading below their intrinsic worth and may offer genuine upside potential.
- Take advantage of game-changing trends by checking out these 24 AI penny stocks, where innovation meets high-growth opportunities in artificial intelligence.
- Target dependable income streams by browsing these 16 dividend stocks with yields > 3%, highlighting companies with yields over 3% and strong fundamentals to match.
This article by Simply Wall St is general in nature. We provide commentary based on historical data and analyst forecasts only using an unbiased methodology and our articles are not intended to be financial advice. It does not constitute a recommendation to buy or sell any stock, and does not take account of your objectives, or your financial situation. We aim to bring you long-term focused analysis driven by fundamental data. Note that our analysis may not factor in the latest price-sensitive company announcements or qualitative material. Simply Wall St has no position in any stocks mentioned.
New: AI Stock Screener & Alerts
Our new AI Stock Screener scans the market every day to uncover opportunities.
• Dividend Powerhouses (3%+ Yield)
• Undervalued Small Caps with Insider Buying
• High growth Tech and AI Companies
Or build your own from over 50 metrics.
Have feedback on this article? Concerned about the content? Get in touch with us directly. Alternatively, email editorial-team@simplywallst.com
About TSE:8088
Iwatani
Engages in supplying gases and energy in Japan, China, Taiwan, South Korea, Singapore, Thailand, Malaysia, Indonesia, Vietnam, the United States, and Australia.
Excellent balance sheet average dividend payer.
Similar Companies
Market Insights

Advertisement
Community Narratives
The "Molecular Pencil": Why Beam's Technology is Built to Win
Fair Value US$65.01|66.7% undervalued
DA
Community Contributor
The silent giant behind virtually every advanced chip powering AI, smartphones, and modern infrastructure.
Fair Value US$310.00|4.8% undervalued
OS
Community Contributor
ADP Stock: Solid Fundamentals, But AI Investments Test Its Margin Resilience
Fair Value US$387.77|34.5% undervalued
YI
Community Contributor
MINISO's fair value is projected at 26.69 with an anticipated PE ratio shift of 20x
Fair Value US$24.03|9.6% undervalued
BE
Community Contributor