Advertisement
- Japan
- /
- Oil and Gas
- /
- TSE:5019
Idemitsu Kosan (TSE:5019): Reassessing Valuation After Upgraded Guidance and New Share Buyback

Simply Wall St
Reviewed by Simply Wall St
Idemitsu Kosan Ltd. (TSE:5019) got the market’s attention this week after it raised full-year earnings guidance, launched a substantial share buyback, and reaffirmed its dividend. These developments point to strong business momentum.
See our latest analysis for Idemitsu KosanLtd.
Idemitsu KosanLtd has seen a burst of momentum lately, driven by robust earnings guidance, a new share buyback, and forward-thinking partnerships in energy tech. Over the last year, its total shareholder return was 11.6%. Its three- and five-year total returns stand out at 96.6% and 209% respectively. This underscores impressive longer-term wealth creation as the share price has climbed 10.4% in the past month.
If you’re interested in uncovering more opportunities, now is a great time to broaden your search and discover fast growing stocks with high insider ownership
With guidance sharply revised upward and a sizable buyback underway, investors are left to decide whether Idemitsu KosanLtd’s strong momentum still leaves room for upside or if the recent gains already account for future growth potential.
Price-to-Earnings of 95.5x: Is it justified?
At a last close price of ¥1,113.5, Idemitsu KosanLtd’s stock is trading on an eye-catching price-to-earnings (P/E) ratio of 95.5x. This is much higher than both regional peers and industry averages, making it look expensive by conventional standards.
The price-to-earnings ratio measures how much investors are willing to pay today for each unit of the company’s earnings. It is a widely watched benchmark for gauging how the market values growth prospects and profitability, especially in capital-intensive sectors like oil and gas.
Such a steep multiple suggests that the market is pricing in considerable future earnings growth, but also raises questions over whether investor expectations have run too far ahead of fundamentals. With this level of valuation, the market may be overlooking recent volatility in earnings and ongoing industry challenges.
Idemitsu KosanLtd’s P/E ratio is vastly higher than the Asian Oil and Gas industry average of 13.3x. Even compared to its peer group at 15.1x or our estimate of fair P/E at 23.4x, the stock looks severely stretched. If the market reverts toward these lower benchmarks, it could mean significant downside from current levels.
Explore the SWS fair ratio for Idemitsu KosanLtd
Result: Price-to-Earnings of 95.5x (OVERVALUED)
However, slower annual revenue growth and the stock trading above analyst price targets could signal caution as the market reassesses future expectations.
Find out about the key risks to this Idemitsu KosanLtd narrative.
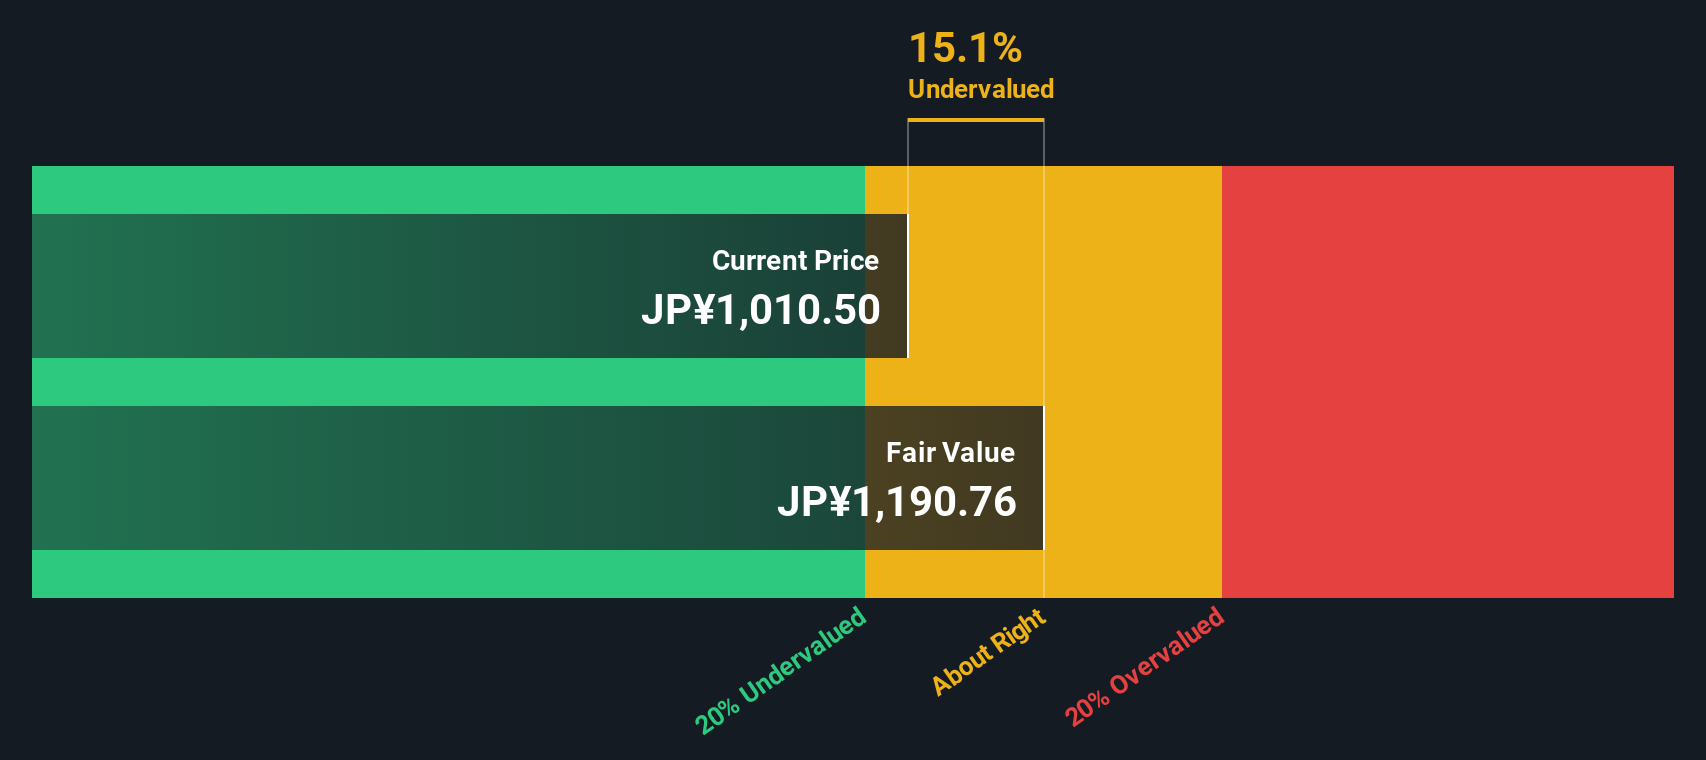
Another View: SWS DCF Model Points to Undervaluation
While the price-to-earnings ratio makes Idemitsu KosanLtd look expensive, our DCF model offers a different story. According to this method, shares are actually trading 19.4% below fair value. This suggests the stock could have more upside than the multiples alone imply. Which view will the market believe?
Look into how the SWS DCF model arrives at its fair value.
Simply Wall St performs a discounted cash flow (DCF) on every stock in the world every day (check out Idemitsu KosanLtd for example). We show the entire calculation in full. You can track the result in your watchlist or portfolio and be alerted when this changes, or use our stock screener to discover 858 undervalued stocks based on their cash flows. If you save a screener we even alert you when new companies match - so you never miss a potential opportunity.
Build Your Own Idemitsu KosanLtd Narrative
If you want to reach your own conclusions or dig into the numbers yourself, crafting your own perspective is simple and takes only a couple of minutes, so why not Do it your way
A great starting point for your Idemitsu KosanLtd research is our analysis highlighting 2 key rewards and 4 important warning signs that could impact your investment decision.
Looking for more investment ideas?
Why limit yourself to one opportunity when you could tap into markets on the move? Use these tailored picks to find your next standout investment today.
- Target income and stability by checking out these 15 dividend stocks with yields > 3%. This tool highlights businesses paying yields over 3% and rewarding long-term holders.
- Tap into the explosive growth of artificial intelligence with these 25 AI penny stocks to uncover companies making waves in machine learning and automation.
- Stay ahead of the pack by exploring these 82 cryptocurrency and blockchain stocks, where you’ll find innovative businesses capitalizing on cryptocurrency and blockchain advancements.
This article by Simply Wall St is general in nature. We provide commentary based on historical data and analyst forecasts only using an unbiased methodology and our articles are not intended to be financial advice. It does not constitute a recommendation to buy or sell any stock, and does not take account of your objectives, or your financial situation. We aim to bring you long-term focused analysis driven by fundamental data. Note that our analysis may not factor in the latest price-sensitive company announcements or qualitative material. Simply Wall St has no position in any stocks mentioned.
New: AI Stock Screener & Alerts
Our new AI Stock Screener scans the market every day to uncover opportunities.
• Dividend Powerhouses (3%+ Yield)
• Undervalued Small Caps with Insider Buying
• High growth Tech and AI Companies
Or build your own from over 50 metrics.
Have feedback on this article? Concerned about the content? Get in touch with us directly. Alternatively, email editorial-team@simplywallst.com
About TSE:5019
Idemitsu KosanLtd
Engages in the petroleum, basic chemicals, functional materials, power and renewable energy, and resources businesses in Japan, rest of Asia, Oceania, North America, and internationally.
Excellent balance sheet average dividend payer.
Similar Companies
Market Insights

Advertisement
Community Narratives
The "Molecular Pencil": Why Beam's Technology is Built to Win
Fair Value US$65.01|65.4% undervalued
DA
Community Contributor
The silent giant behind virtually every advanced chip powering AI, smartphones, and modern infrastructure.
Fair Value US$310.00|6.1% undervalued
OS
Community Contributor
ADP Stock: Solid Fundamentals, But AI Investments Test Its Margin Resilience
Fair Value US$387.77|34.2% undervalued
YI
Community Contributor
MINISO's fair value is projected at 26.69 with an anticipated PE ratio shift of 20x
Fair Value US$24.03|9.6% undervalued
BE
Community Contributor