Advertisement
- Japan
- /
- Capital Markets
- /
- TSE:8698
Monex Group (TSE:8698): Valuation in Focus After Strong Earnings and Increased Dividend

Simply Wall St
Reviewed by Simply Wall St
Monex Group (TSE:8698) just shared its half-year results, highlighting stronger revenue and net income. Alongside the earnings release, the company announced a higher dividend for both the current quarter and full year.
See our latest analysis for Monex Group.
Monex Group’s shares have faced a tough stretch in 2024, with a 1-year total shareholder return of -25.4%. This comes even as the company delivered stronger interim earnings and increased its dividend payouts. Short-term selling pressure has weighed on the stock. However, its long-term total returns of 82% over three years and 143% over five years highlight that momentum can shift quickly for active investors.
If improved results have you thinking about what’s next, now’s a great moment to broaden your investing horizons and discover fast growing stocks with high insider ownership
With shares still trading below analyst price targets despite recent gains, the question now is whether Monex Group is an undervalued opportunity or if the market has already factored in its improved performance and future prospects.
Price-to-Sales of 2.5x: Is it justified?
Monex Group is trading at a price-to-sales (P/S) ratio of 2.5x with a recent closing price of ¥725. This places it above both the estimated fair P/S ratio and the industry average. This premium raises questions about investors' growth expectations and whether current valuations align with the company’s fundamentals.
The price-to-sales ratio compares a company’s market capitalization to its annual revenue, giving investors a sense of how much the market values each unit of sales. In capital markets firms, P/S can be especially telling when profits remain volatile or negative, since sales are often more stable than earnings. A premium P/S may suggest investors anticipate significant turnaround or growth ahead.
Despite this optimism, Monex Group's 2.5x P/S stands above the Fair Price-to-Sales Ratio estimate of 2.2x. Compared to the JP Capital Markets industry average of 2.2x, the stock appears overvalued. Yet, it is attractively valued relative to the peer average, which stands at 3.4x. The market may re-rate the stock if future performance either exceeds or falls short of these expectations.
Explore the SWS fair ratio for Monex Group
Result: Price-to-Sales of 2.5x (OVERVALUED)
However, continued revenue declines or an extended period of weak stock performance could challenge optimism around Monex Group’s current valuation premium.
Find out about the key risks to this Monex Group narrative.
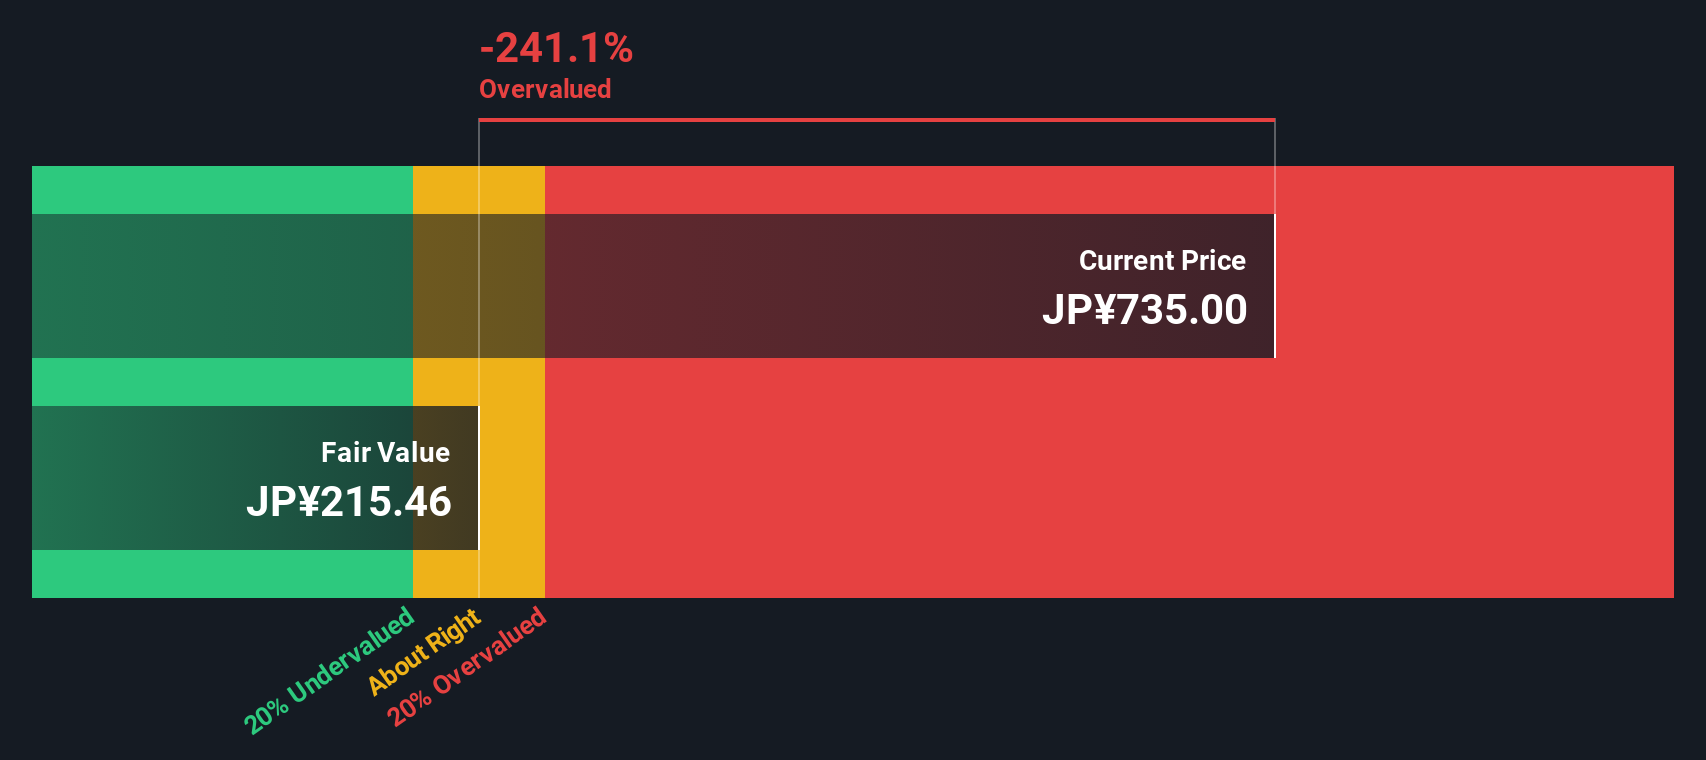
Another View: Discounted Cash Flow Signals Overvaluation
While Monex Group’s price-to-sales ratio suggests a valuation premium, our DCF model presents an even starker perspective. The SWS DCF model estimates fair value at ¥210.95, which is well below the current price of ¥725. This wide gap puts the spotlight on expectations. Are investors looking too far ahead?
Look into how the SWS DCF model arrives at its fair value.
Simply Wall St performs a discounted cash flow (DCF) on every stock in the world every day (check out Monex Group for example). We show the entire calculation in full. You can track the result in your watchlist or portfolio and be alerted when this changes, or use our stock screener to discover 919 undervalued stocks based on their cash flows. If you save a screener we even alert you when new companies match - so you never miss a potential opportunity.
Build Your Own Monex Group Narrative
Keep in mind, if our analysis doesn’t match your view or you’d rather dive into the numbers yourself, you can shape your own perspective and Do it your way.
A great starting point for your Monex Group research is our analysis highlighting 1 key reward and 2 important warning signs that could impact your investment decision.
Looking for more investment ideas?
Don’t let standout opportunities slip away. Put your next move ahead of the curve with hand-picked stock lists catering to breakthrough trends and solid returns.
- Boost your portfolio’s income potential by uncovering steady earners delivering above-average payouts in these 16 dividend stocks with yields > 3%.
- Catch the innovators set to transform healthcare by tapping into rapid progress in artificial intelligence with these 30 healthcare AI stocks.
- Jump on tomorrow’s leaders and spot overlooked gems positioned for dramatic share price growth using these 919 undervalued stocks based on cash flows.
This article by Simply Wall St is general in nature. We provide commentary based on historical data and analyst forecasts only using an unbiased methodology and our articles are not intended to be financial advice. It does not constitute a recommendation to buy or sell any stock, and does not take account of your objectives, or your financial situation. We aim to bring you long-term focused analysis driven by fundamental data. Note that our analysis may not factor in the latest price-sensitive company announcements or qualitative material. Simply Wall St has no position in any stocks mentioned.
New: Manage All Your Stock Portfolios in One Place
We've created the ultimate portfolio companion for stock investors, and it's free.
• Connect an unlimited number of Portfolios and see your total in one currency
• Be alerted to new Warning Signs or Risks via email or mobile
• Track the Fair Value of your stocks
Have feedback on this article? Concerned about the content? Get in touch with us directly. Alternatively, email editorial-team@simplywallst.com
About TSE:8698
Monex Group
An online financial institution, provides retail online brokerage services.
Excellent balance sheet average dividend payer.
Market Insights

Advertisement
Community Narratives
MicroVision will explode future revenue by 380.37% with a vision towards success
Fair Value US$60.00|98.5% undervalued
TH
Community Contributor
The Indispensable Artery for a New North American Economy
Fair Value CA$132.87|2.3% undervalued
TI
Community Contributor