Stock Analysis
- Japan
- /
- Capital Markets
- /
- TSE:8595
The three-year earnings decline is not helping JAFCO Group's (TSE:8595 share price, as stock falls another 7.7% in past week


In order to justify the effort of selecting individual stocks, it's worth striving to beat the returns from a market index fund. But if you try your hand at stock picking, your risk returning less than the market. We regret to report that long term JAFCO Group Co., Ltd. (TSE:8595) shareholders have had that experience, with the share price dropping 30% in three years, versus a market return of about 44%. On top of that, the share price is down 7.7% in the last week.
If the past week is anything to go by, investor sentiment for JAFCO Group isn't positive, so let's see if there's a mismatch between fundamentals and the share price.
See our latest analysis for JAFCO Group
There is no denying that markets are sometimes efficient, but prices do not always reflect underlying business performance. One imperfect but simple way to consider how the market perception of a company has shifted is to compare the change in the earnings per share (EPS) with the share price movement.
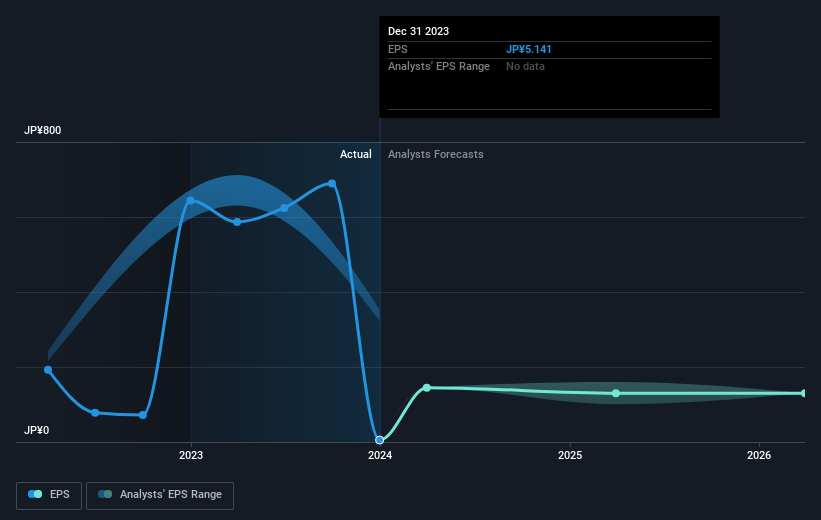
During the three years that the share price fell, JAFCO Group's earnings per share (EPS) dropped by 39% each year. This fall in the EPS is worse than the 11% compound annual share price fall. This suggests that the market retains some optimism around long term earnings stability, despite past EPS declines. With a P/E ratio of 323.72, it's fair to say the market sees a brighter future for the business.
You can see how EPS has changed over time in the image below (click on the chart to see the exact values).
Before buying or selling a stock, we always recommend a close examination of historic growth trends, available here.
What About Dividends?
When looking at investment returns, it is important to consider the difference between total shareholder return (TSR) and share price return. The TSR incorporates the value of any spin-offs or discounted capital raisings, along with any dividends, based on the assumption that the dividends are reinvested. Arguably, the TSR gives a more comprehensive picture of the return generated by a stock. In the case of JAFCO Group, it has a TSR of -19% for the last 3 years. That exceeds its share price return that we previously mentioned. And there's no prize for guessing that the dividend payments largely explain the divergence!
A Different Perspective
Investors in JAFCO Group had a tough year, with a total loss of 4.6% (including dividends), against a market gain of about 33%. Even the share prices of good stocks drop sometimes, but we want to see improvements in the fundamental metrics of a business, before getting too interested. Longer term investors wouldn't be so upset, since they would have made 7%, each year, over five years. If the fundamental data continues to indicate long term sustainable growth, the current sell-off could be an opportunity worth considering. It's always interesting to track share price performance over the longer term. But to understand JAFCO Group better, we need to consider many other factors. Even so, be aware that JAFCO Group is showing 3 warning signs in our investment analysis , and 1 of those is potentially serious...
Of course, you might find a fantastic investment by looking elsewhere. So take a peek at this free list of companies we expect will grow earnings.
Please note, the market returns quoted in this article reflect the market weighted average returns of stocks that currently trade on Japanese exchanges.
Valuation is complex, but we're helping make it simple.
Find out whether JAFCO Group is potentially over or undervalued by checking out our comprehensive analysis, which includes fair value estimates, risks and warnings, dividends, insider transactions and financial health.
View the Free AnalysisHave feedback on this article? Concerned about the content? Get in touch with us directly. Alternatively, email editorial-team (at) simplywallst.com.
This article by Simply Wall St is general in nature. We provide commentary based on historical data and analyst forecasts only using an unbiased methodology and our articles are not intended to be financial advice. It does not constitute a recommendation to buy or sell any stock, and does not take account of your objectives, or your financial situation. We aim to bring you long-term focused analysis driven by fundamental data. Note that our analysis may not factor in the latest price-sensitive company announcements or qualitative material. Simply Wall St has no position in any stocks mentioned.
About TSE:8595
Undervalued with adequate balance sheet and pays a dividend.
