Stock Analysis
- Japan
- /
- Consumer Finance
- /
- TSE:8572
Acom (TSE:8572) stock falls 5.6% in past week as three-year earnings and shareholder returns continue downward trend


As an investor its worth striving to ensure your overall portfolio beats the market average. But if you try your hand at stock picking, you risk returning less than the market. Unfortunately, that's been the case for longer term Acom Co., Ltd. (TSE:8572) shareholders, since the share price is down 21% in the last three years, falling well short of the market return of around 47%. And the share price decline continued over the last week, dropping some 5.6%.
With the stock having lost 5.6% in the past week, it's worth taking a look at business performance and seeing if there's any red flags.
Check out our latest analysis for Acom
To quote Buffett, 'Ships will sail around the world but the Flat Earth Society will flourish. There will continue to be wide discrepancies between price and value in the marketplace...' One flawed but reasonable way to assess how sentiment around a company has changed is to compare the earnings per share (EPS) with the share price.
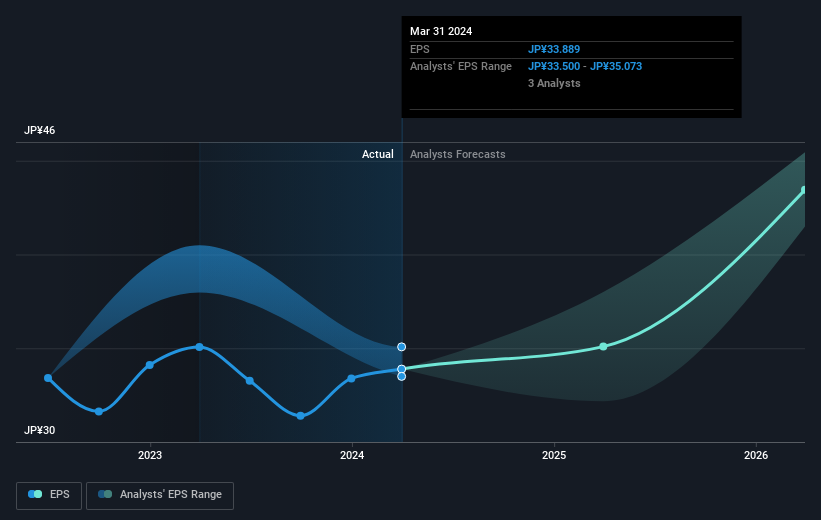
During the three years that the share price fell, Acom's earnings per share (EPS) dropped by 12% each year. This fall in the EPS is worse than the 7% compound annual share price fall. So, despite the prior disappointment, shareholders must have some confidence the situation will improve, longer term.
You can see how EPS has changed over time in the image below (click on the chart to see the exact values).
Dive deeper into Acom's key metrics by checking this interactive graph of Acom's earnings, revenue and cash flow.
What About Dividends?
When looking at investment returns, it is important to consider the difference between total shareholder return (TSR) and share price return. The TSR is a return calculation that accounts for the value of cash dividends (assuming that any dividend received was reinvested) and the calculated value of any discounted capital raisings and spin-offs. So for companies that pay a generous dividend, the TSR is often a lot higher than the share price return. As it happens, Acom's TSR for the last 3 years was -14%, which exceeds the share price return mentioned earlier. This is largely a result of its dividend payments!
A Different Perspective
Acom provided a TSR of 24% over the last twelve months. But that was short of the market average. On the bright side, that's still a gain, and it's actually better than the average return of 3% over half a decade It is possible that returns will improve along with the business fundamentals. While it is well worth considering the different impacts that market conditions can have on the share price, there are other factors that are even more important. Like risks, for instance. Every company has them, and we've spotted 2 warning signs for Acom (of which 1 is significant!) you should know about.
If you are like me, then you will not want to miss this free list of undervalued small caps that insiders are buying.
Please note, the market returns quoted in this article reflect the market weighted average returns of stocks that currently trade on Japanese exchanges.
Valuation is complex, but we're helping make it simple.
Find out whether Acom is potentially over or undervalued by checking out our comprehensive analysis, which includes fair value estimates, risks and warnings, dividends, insider transactions and financial health.
View the Free AnalysisHave feedback on this article? Concerned about the content? Get in touch with us directly. Alternatively, email editorial-team (at) simplywallst.com.
This article by Simply Wall St is general in nature. We provide commentary based on historical data and analyst forecasts only using an unbiased methodology and our articles are not intended to be financial advice. It does not constitute a recommendation to buy or sell any stock, and does not take account of your objectives, or your financial situation. We aim to bring you long-term focused analysis driven by fundamental data. Note that our analysis may not factor in the latest price-sensitive company announcements or qualitative material. Simply Wall St has no position in any stocks mentioned.
About TSE:8572
Acom
Offers loans, credit cards, and loan guarantee services in Japan and internationally.
Undervalued with adequate balance sheet.

