
Advertisement
- Japan
- /
- Consumer Finance
- /
- TSE:7383
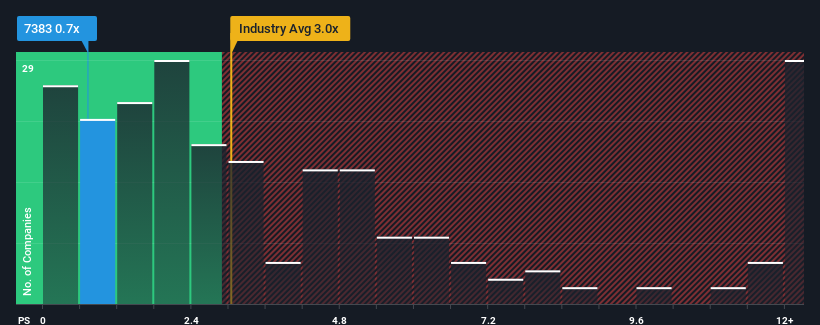
It's Down 27% But Net Protections Holdings, Inc. (TSE:7383) Could Be Riskier Than It Looks
Net Protections Holdings, Inc. (TSE:7383) shareholders that were waiting for something to happen have been dealt a blow with a 27% share price drop in the last month. The recent drop completes a disastrous twelve months for shareholders, who are sitting on a 54% loss during that time.
In spite of the heavy fall in price, there still wouldn't be many who think Net Protections Holdings' price-to-sales (or "P/S") ratio of 0.7x is worth a mention when the median P/S in Japan's Consumer Finance industry is similar at about 0.9x. However, investors might be overlooking a clear opportunity or potential setback if there is no rational basis for the P/S.
View our latest analysis for Net Protections Holdings
What Does Net Protections Holdings' P/S Mean For Shareholders?
There hasn't been much to differentiate Net Protections Holdings' and the industry's revenue growth lately. It seems that many are expecting the mediocre revenue performance to persist, which has held the P/S ratio back. If this is the case, then at least existing shareholders won't be losing sleep over the current share price.
Keen to find out how analysts think Net Protections Holdings' future stacks up against the industry? In that case, our free report is a great place to start.Do Revenue Forecasts Match The P/S Ratio?
The only time you'd be comfortable seeing a P/S like Net Protections Holdings' is when the company's growth is tracking the industry closely.
Retrospectively, the last year delivered a decent 7.8% gain to the company's revenues. The solid recent performance means it was also able to grow revenue by 16% in total over the last three years. So we can start by confirming that the company has actually done a good job of growing revenue over that time.
Turning to the outlook, the next three years should generate growth of 10% per year as estimated by the three analysts watching the company. Meanwhile, the rest of the industry is forecast to only expand by 6.5% per year, which is noticeably less attractive.
With this information, we find it interesting that Net Protections Holdings is trading at a fairly similar P/S compared to the industry. Apparently some shareholders are skeptical of the forecasts and have been accepting lower selling prices.
What Does Net Protections Holdings' P/S Mean For Investors?
Net Protections Holdings' plummeting stock price has brought its P/S back to a similar region as the rest of the industry. Using the price-to-sales ratio alone to determine if you should sell your stock isn't sensible, however it can be a practical guide to the company's future prospects.
Looking at Net Protections Holdings' analyst forecasts revealed that its superior revenue outlook isn't giving the boost to its P/S that we would've expected. When we see a strong revenue outlook, with growth outpacing the industry, we can only assume potential uncertainty around these figures are what might be placing slight pressure on the P/S ratio. It appears some are indeed anticipating revenue instability, because these conditions should normally provide a boost to the share price.
Before you settle on your opinion, we've discovered 1 warning sign for Net Protections Holdings that you should be aware of.
If strong companies turning a profit tickle your fancy, then you'll want to check out this free list of interesting companies that trade on a low P/E (but have proven they can grow earnings).
Valuation is complex, but we're here to simplify it.
Discover if Net Protections Holdings might be undervalued or overvalued with our detailed analysis, featuring fair value estimates, potential risks, dividends, insider trades, and its financial condition.
Access Free AnalysisHave feedback on this article? Concerned about the content? Get in touch with us directly. Alternatively, email editorial-team (at) simplywallst.com.
This article by Simply Wall St is general in nature. We provide commentary based on historical data and analyst forecasts only using an unbiased methodology and our articles are not intended to be financial advice. It does not constitute a recommendation to buy or sell any stock, and does not take account of your objectives, or your financial situation. We aim to bring you long-term focused analysis driven by fundamental data. Note that our analysis may not factor in the latest price-sensitive company announcements or qualitative material. Simply Wall St has no position in any stocks mentioned.
Have feedback on this article? Concerned about the content? Get in touch with us directly. Alternatively, email editorial-team@simplywallst.com
About TSE:7383
Net Protections Holdings
Provides buy now pay later (BNPL) payment services in Japan and internationally.
Flawless balance sheet with solid track record.
Market Insights

Advertisement
Community Narratives
MicroVision will explode future revenue by 380.37% with a vision towards success
Fair Value US$60|98.4% undervalued
TH
Community Contributor
The Indispensable Artery for a New North American Economy
Fair Value CA$132.87|1.6% undervalued
TI
Community Contributor
Recently Updated Narratives
BE


Bejgal on MINISO Group Holding ·
MINISO's fair value is projected at 26.69 with an anticipated PE ratio shift of 20x
Fair Value:US$26.6928.0% undervalued
44 followersusers have followed this narrative
3 commentsusers have commented on this narrative
0 likesusers have liked this narrative
TI


TickerTickle on Oracle ·
The Quiet Giant That Became AI’s Power Grid
Fair Value:US$389.8149.5% undervalued
7 followersusers have followed this narrative
1 commentusers have commented on this narrative
0 likesusers have liked this narrative
AU

AuCA on Nova Ljubljanska Banka d.d ·
Nova Ljubljanska Banka d.d will expect a 11.2% revenue boost driving future growth
Fair Value:€20916.5% undervalued
23 followersusers have followed this narrative
3 commentsusers have commented on this narrative
0 likesusers have liked this narrative
Popular Narratives
OS


oscargarcia on Alphabet ·
The company that turned a verb into a global necessity and basically runs the modern internet, digital ads, smartphones, maps, and AI.
Fair Value:US$3404.9% undervalued
136 followersusers have followed this narrative
6 commentsusers have commented on this narrative
18 likesusers have liked this narrative
TH

TheWallstreetKing on MicroVision ·
MicroVision will explode future revenue by 380.37% with a vision towards success
Fair Value:US$6098.4% undervalued
88 followersusers have followed this narrative
11 commentsusers have commented on this narrative
18 likesusers have liked this narrative
AN


AnalystConsensusTarget on NVIDIA ·
NVDA: Expanding AI Demand Will Drive Major Data Center Investments Through 2026
Fair Value:US$232.7923.6% undervalued
925 followersusers have followed this narrative
6 commentsusers have commented on this narrative
22 likesusers have liked this narrative