Stock Analysis
- Japan
- /
- Consumer Services
- /
- TSE:9696
With us Corporation (TSE:9696) Stock's Been Sliding But Fundamentals Look Decent: Will The Market Correct The Share Price In The Future?


With us (TSE:9696) has had a rough three months with its share price down 14%. However, stock prices are usually driven by a company’s financials over the long term, which in this case look pretty respectable. In this article, we decided to focus on With us' ROE.
Return on equity or ROE is a key measure used to assess how efficiently a company's management is utilizing the company's capital. In short, ROE shows the profit each dollar generates with respect to its shareholder investments.
See our latest analysis for With us
How To Calculate Return On Equity?
The formula for ROE is:
Return on Equity = Net Profit (from continuing operations) ÷ Shareholders' Equity
So, based on the above formula, the ROE for With us is:
7.0% = JP¥420m ÷ JP¥6.0b (Based on the trailing twelve months to December 2023).
The 'return' is the profit over the last twelve months. One way to conceptualize this is that for each ¥1 of shareholders' capital it has, the company made ¥0.07 in profit.
What Is The Relationship Between ROE And Earnings Growth?
So far, we've learned that ROE is a measure of a company's profitability. Based on how much of its profits the company chooses to reinvest or "retain", we are then able to evaluate a company's future ability to generate profits. Generally speaking, other things being equal, firms with a high return on equity and profit retention, have a higher growth rate than firms that don’t share these attributes.
With us' Earnings Growth And 7.0% ROE
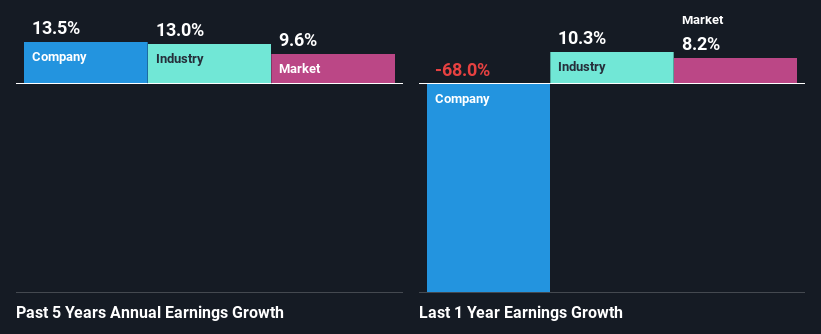
On the face of it, With us' ROE is not much to talk about. Next, when compared to the average industry ROE of 12%, the company's ROE leaves us feeling even less enthusiastic. However, the moderate 14% net income growth seen by With us over the past five years is definitely a positive. We reckon that there could be other factors at play here. For example, it is possible that the company's management has made some good strategic decisions, or that the company has a low payout ratio.
Next, on comparing With us' net income growth with the industry, we found that the company's reported growth is similar to the industry average growth rate of 13% over the last few years.
Earnings growth is an important metric to consider when valuing a stock. What investors need to determine next is if the expected earnings growth, or the lack of it, is already built into the share price. Doing so will help them establish if the stock's future looks promising or ominous. One good indicator of expected earnings growth is the P/E ratio which determines the price the market is willing to pay for a stock based on its earnings prospects. So, you may want to check if With us is trading on a high P/E or a low P/E, relative to its industry.
Is With us Using Its Retained Earnings Effectively?
In With us' case, its respectable earnings growth can probably be explained by its low three-year median payout ratio of 17% (or a retention ratio of 83%), which suggests that the company is investing most of its profits to grow its business.
Moreover, With us is determined to keep sharing its profits with shareholders which we infer from its long history of paying a dividend for at least ten years.
Conclusion
In total, it does look like With us has some positive aspects to its business. Despite its low rate of return, the fact that the company reinvests a very high portion of its profits into its business, no doubt contributed to its high earnings growth. With that said, the latest industry analyst forecasts reveal that the company's earnings are expected to accelerate. To know more about the company's future earnings growth forecasts take a look at this free report on analyst forecasts for the company to find out more.
Valuation is complex, but we're helping make it simple.
Find out whether With us is potentially over or undervalued by checking out our comprehensive analysis, which includes fair value estimates, risks and warnings, dividends, insider transactions and financial health.
View the Free AnalysisHave feedback on this article? Concerned about the content? Get in touch with us directly. Alternatively, email editorial-team (at) simplywallst.com.
This article by Simply Wall St is general in nature. We provide commentary based on historical data and analyst forecasts only using an unbiased methodology and our articles are not intended to be financial advice. It does not constitute a recommendation to buy or sell any stock, and does not take account of your objectives, or your financial situation. We aim to bring you long-term focused analysis driven by fundamental data. Note that our analysis may not factor in the latest price-sensitive company announcements or qualitative material. Simply Wall St has no position in any stocks mentioned.
About TSE:9696
With us
With us Corporation, together with its subsidiaries, operates as an education service company in Japan.
Established dividend payer with adequate balance sheet.
