- Japan
- /
- Hospitality
- /
- TSE:9603
Retail investors among H.I.S. Co., Ltd.'s (TSE:9603) largest stockholders and were hit after last week's 6.0% price drop


Key Insights
- Significant control over H.I.S by retail investors implies that the general public has more power to influence management and governance-related decisions
- 50% of the business is held by the top 12 shareholders
- Insiders own 33% of H.I.S
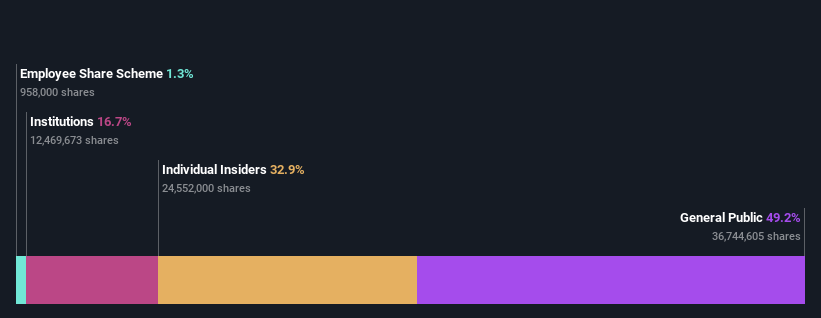
If you want to know who really controls H.I.S. Co., Ltd. (TSE:9603), then you'll have to look at the makeup of its share registry. And the group that holds the biggest piece of the pie are retail investors with 49% ownership. Put another way, the group faces the maximum upside potential (or downside risk).
While insiders who own 33% came under pressure after market cap dropped to JP¥123b last week,retail investors took the most losses.
In the chart below, we zoom in on the different ownership groups of H.I.S.
See our latest analysis for H.I.S
What Does The Institutional Ownership Tell Us About H.I.S?
Institutions typically measure themselves against a benchmark when reporting to their own investors, so they often become more enthusiastic about a stock once it's included in a major index. We would expect most companies to have some institutions on the register, especially if they are growing.
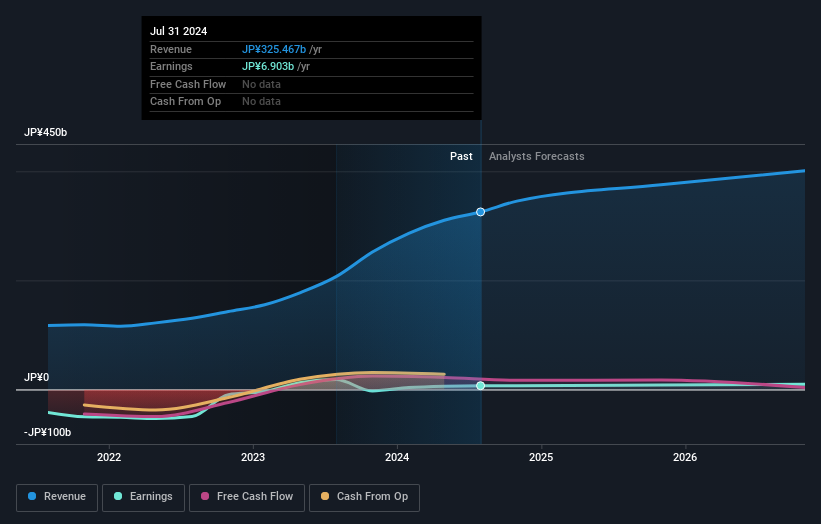
H.I.S already has institutions on the share registry. Indeed, they own a respectable stake in the company. This implies the analysts working for those institutions have looked at the stock and they like it. But just like anyone else, they could be wrong. If multiple institutions change their view on a stock at the same time, you could see the share price drop fast. It's therefore worth looking at H.I.S' earnings history below. Of course, the future is what really matters.
Hedge funds don't have many shares in H.I.S. Looking at our data, we can see that the largest shareholder is Hideo Sawada with 30% of shares outstanding. Meanwhile, the second and third largest shareholders, hold 3.7% and 3.1%, of the shares outstanding, respectively.
A closer look at our ownership figures suggests that the top 12 shareholders have a combined ownership of 50% implying that no single shareholder has a majority.
While it makes sense to study institutional ownership data for a company, it also makes sense to study analyst sentiments to know which way the wind is blowing. There are a reasonable number of analysts covering the stock, so it might be useful to find out their aggregate view on the future.
Insider Ownership Of H.I.S
The definition of an insider can differ slightly between different countries, but members of the board of directors always count. Company management run the business, but the CEO will answer to the board, even if he or she is a member of it.
Most consider insider ownership a positive because it can indicate the board is well aligned with other shareholders. However, on some occasions too much power is concentrated within this group.
Our information suggests that insiders maintain a significant holding in H.I.S. Co., Ltd.. Insiders have a JP¥40b stake in this JP¥123b business. This may suggest that the founders still own a lot of shares. You can click here to see if they have been buying or selling.
General Public Ownership
With a 49% ownership, the general public, mostly comprising of individual investors, have some degree of sway over H.I.S. While this group can't necessarily call the shots, it can certainly have a real influence on how the company is run.
Next Steps:
It's always worth thinking about the different groups who own shares in a company. But to understand H.I.S better, we need to consider many other factors. Be aware that H.I.S is showing 3 warning signs in our investment analysis , and 1 of those shouldn't be ignored...
If you would prefer discover what analysts are predicting in terms of future growth, do not miss this free report on analyst forecasts.
NB: Figures in this article are calculated using data from the last twelve months, which refer to the 12-month period ending on the last date of the month the financial statement is dated. This may not be consistent with full year annual report figures.
Valuation is complex, but we're here to simplify it.
Discover if H.I.S might be undervalued or overvalued with our detailed analysis, featuring fair value estimates, potential risks, dividends, insider trades, and its financial condition.
Access Free AnalysisHave feedback on this article? Concerned about the content? Get in touch with us directly. Alternatively, email editorial-team (at) simplywallst.com.
This article by Simply Wall St is general in nature. We provide commentary based on historical data and analyst forecasts only using an unbiased methodology and our articles are not intended to be financial advice. It does not constitute a recommendation to buy or sell any stock, and does not take account of your objectives, or your financial situation. We aim to bring you long-term focused analysis driven by fundamental data. Note that our analysis may not factor in the latest price-sensitive company announcements or qualitative material. Simply Wall St has no position in any stocks mentioned.
About TSE:9603
Very undervalued with moderate growth potential.
Market Insights

Community Narratives
