
Advertisement
- Japan
- /
- Consumer Services
- /
- TSE:7083
AHC Group Inc. (TSE:7083) Shares May Have Slumped 35% But Getting In Cheap Is Still Unlikely
The AHC Group Inc. (TSE:7083) share price has softened a substantial 35% over the previous 30 days, handing back much of the gains the stock has made lately. Of course, over the longer-term many would still wish they owned shares as the stock's price has soared 165% in the last twelve months.
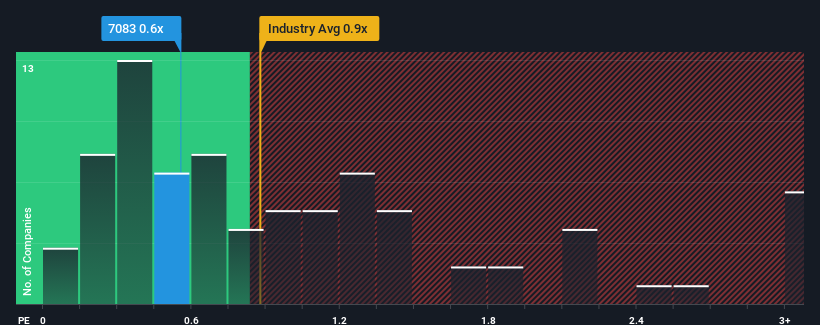
In spite of the heavy fall in price, it's still not a stretch to say that AHC Group's price-to-sales (or "P/S") ratio of 0.6x right now seems quite "middle-of-the-road" compared to the Consumer Services industry in Japan, where the median P/S ratio is around 0.9x. While this might not raise any eyebrows, if the P/S ratio is not justified investors could be missing out on a potential opportunity or ignoring looming disappointment.
Check out our latest analysis for AHC Group
How AHC Group Has Been Performing
AHC Group's revenue growth of late has been pretty similar to most other companies. It seems that many are expecting the mediocre revenue performance to persist, which has held the P/S ratio back. If you like the company, you'd be hoping this can at least be maintained so that you could pick up some stock while it's not quite in favour.
If you'd like to see what analysts are forecasting going forward, you should check out our free report on AHC Group.How Is AHC Group's Revenue Growth Trending?
In order to justify its P/S ratio, AHC Group would need to produce growth that's similar to the industry.
Retrospectively, the last year delivered a decent 14% gain to the company's revenues. This was backed up an excellent period prior to see revenue up by 51% in total over the last three years. Therefore, it's fair to say the revenue growth recently has been superb for the company.
Looking ahead now, revenue is anticipated to climb by 6.4% during the coming year according to the only analyst following the company. That's shaping up to be materially lower than the 12% growth forecast for the broader industry.
With this information, we find it interesting that AHC Group is trading at a fairly similar P/S compared to the industry. It seems most investors are ignoring the fairly limited growth expectations and are willing to pay up for exposure to the stock. These shareholders may be setting themselves up for future disappointment if the P/S falls to levels more in line with the growth outlook.
The Bottom Line On AHC Group's P/S
With its share price dropping off a cliff, the P/S for AHC Group looks to be in line with the rest of the Consumer Services industry. We'd say the price-to-sales ratio's power isn't primarily as a valuation instrument but rather to gauge current investor sentiment and future expectations.
Our look at the analysts forecasts of AHC Group's revenue prospects has shown that its inferior revenue outlook isn't negatively impacting its P/S as much as we would have predicted. When we see companies with a relatively weaker revenue outlook compared to the industry, we suspect the share price is at risk of declining, sending the moderate P/S lower. A positive change is needed in order to justify the current price-to-sales ratio.
Having said that, be aware AHC Group is showing 3 warning signs in our investment analysis, and 2 of those make us uncomfortable.
If strong companies turning a profit tickle your fancy, then you'll want to check out this free list of interesting companies that trade on a low P/E (but have proven they can grow earnings).
New: Manage All Your Stock Portfolios in One Place
We've created the ultimate portfolio companion for stock investors, and it's free.
• Connect an unlimited number of Portfolios and see your total in one currency
• Be alerted to new Warning Signs or Risks via email or mobile
• Track the Fair Value of your stocks
Have feedback on this article? Concerned about the content? Get in touch with us directly. Alternatively, email editorial-team (at) simplywallst.com.
This article by Simply Wall St is general in nature. We provide commentary based on historical data and analyst forecasts only using an unbiased methodology and our articles are not intended to be financial advice. It does not constitute a recommendation to buy or sell any stock, and does not take account of your objectives, or your financial situation. We aim to bring you long-term focused analysis driven by fundamental data. Note that our analysis may not factor in the latest price-sensitive company announcements or qualitative material. Simply Wall St has no position in any stocks mentioned.
Have feedback on this article? Concerned about the content? Get in touch with us directly. Alternatively, email editorial-team@simplywallst.com
About TSE:7083
AHC Group
Operates in the welfare, nursing care, restaurant, and other businesses in Japan.
Mediocre balance sheet with low risk.
Market Insights

Advertisement
Community Narratives
The company that turned a verb into a global necessity and basically runs the modern internet, digital ads, smartphones, maps, and AI.
Fair Value US$300.00|6.3% undervalued
OS
Community Contributor
Flowers Foods Pays A Fair Price For Health
Fair Value US$16.12|26.0% undervalued
NV
Community Contributor
TMX Group will thrive with 33.3% profit margin and enduring market moat
Fair Value CA$49.90|3.7% overvalued
LI
Community Contributor