
Advertisement
The external fund manager backed by Berkshire Hathaway's Charlie Munger, Li Lu, makes no bones about it when he says 'The biggest investment risk is not the volatility of prices, but whether you will suffer a permanent loss of capital.' So it seems the smart money knows that debt - which is usually involved in bankruptcies - is a very important factor, when you assess how risky a company is. As with many other companies Tabikobo Co. Ltd. (TSE:6548) makes use of debt. But should shareholders be worried about its use of debt?
Why Does Debt Bring Risk?
Debt is a tool to help businesses grow, but if a business is incapable of paying off its lenders, then it exists at their mercy. Ultimately, if the company can't fulfill its legal obligations to repay debt, shareholders could walk away with nothing. However, a more frequent (but still costly) occurrence is where a company must issue shares at bargain-basement prices, permanently diluting shareholders, just to shore up its balance sheet. Of course, plenty of companies use debt to fund growth, without any negative consequences. The first thing to do when considering how much debt a business uses is to look at its cash and debt together.
See our latest analysis for Tabikobo
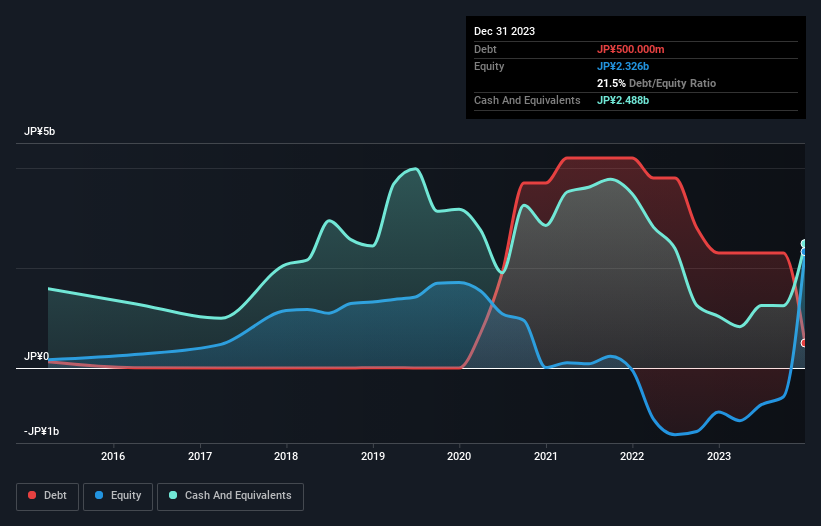
What Is Tabikobo's Net Debt?
You can click the graphic below for the historical numbers, but it shows that Tabikobo had JP¥500.0m of debt in December 2023, down from JP¥2.30b, one year before. But it also has JP¥2.49b in cash to offset that, meaning it has JP¥1.99b net cash.
A Look At Tabikobo's Liabilities
The latest balance sheet data shows that Tabikobo had liabilities of JP¥694.0m due within a year, and liabilities of JP¥540.0m falling due after that. On the other hand, it had cash of JP¥2.49b and JP¥236.0m worth of receivables due within a year. So it actually has JP¥1.49b more liquid assets than total liabilities.
This surplus strongly suggests that Tabikobo has a rock-solid balance sheet (and the debt is of no concern whatsoever). Having regard to this fact, we think its balance sheet is as strong as an ox. Succinctly put, Tabikobo boasts net cash, so it's fair to say it does not have a heavy debt load! The balance sheet is clearly the area to focus on when you are analysing debt. But you can't view debt in total isolation; since Tabikobo will need earnings to service that debt. So if you're keen to discover more about its earnings, it might be worth checking out this graph of its long term earnings trend.
Over 12 months, Tabikobo reported revenue of JP¥2.6b, which is a gain of 156%, although it did not report any earnings before interest and tax. So there's no doubt that shareholders are cheering for growth
So How Risky Is Tabikobo?
Statistically speaking companies that lose money are riskier than those that make money. And the fact is that over the last twelve months Tabikobo lost money at the earnings before interest and tax (EBIT) line. Indeed, in that time it burnt through JP¥773m of cash and made a loss of JP¥454m. But the saving grace is the JP¥1.99b on the balance sheet. That kitty means the company can keep spending for growth for at least two years, at current rates. Importantly, Tabikobo's revenue growth is hot to trot. High growth pre-profit companies may well be risky, but they can also offer great rewards. When analysing debt levels, the balance sheet is the obvious place to start. However, not all investment risk resides within the balance sheet - far from it. To that end, you should learn about the 4 warning signs we've spotted with Tabikobo (including 3 which are a bit concerning) .
If, after all that, you're more interested in a fast growing company with a rock-solid balance sheet, then check out our list of net cash growth stocks without delay.
Valuation is complex, but we're here to simplify it.
Discover if Tabikobo might be undervalued or overvalued with our detailed analysis, featuring fair value estimates, potential risks, dividends, insider trades, and its financial condition.
Access Free AnalysisHave feedback on this article? Concerned about the content? Get in touch with us directly. Alternatively, email editorial-team (at) simplywallst.com.
This article by Simply Wall St is general in nature. We provide commentary based on historical data and analyst forecasts only using an unbiased methodology and our articles are not intended to be financial advice. It does not constitute a recommendation to buy or sell any stock, and does not take account of your objectives, or your financial situation. We aim to bring you long-term focused analysis driven by fundamental data. Note that our analysis may not factor in the latest price-sensitive company announcements or qualitative material. Simply Wall St has no position in any stocks mentioned.
About TSE:6548
Adequate balance sheet and slightly overvalued.
Market Insights

Advertisement
Community Narratives
The company that turned a verb into a global necessity and basically runs the modern internet, digital ads, smartphones, maps, and AI.
Fair Value US$300.00|5.4% undervalued
OS
Community Contributor
Flowers Foods Pays A Fair Price For Health
Fair Value US$16.12|26.3% undervalued
NV
Community Contributor
TMX Group will thrive with 33.3% profit margin and enduring market moat
Fair Value CA$49.90|4.1% overvalued
LI
Community Contributor
The "Molecular Pencil": Why Beam's Technology is Built to Win
Fair Value US$65.01|62.7% undervalued
DA
Community Contributor