Stock Analysis
- Japan
- /
- Hospitality
- /
- TSE:5136
tripla Co., Ltd.'s (TSE:5136) Stock Has Been Sliding But Fundamentals Look Strong: Is The Market Wrong?


tripla (TSE:5136) has had a rough three months with its share price down 29%. However, a closer look at its sound financials might cause you to think again. Given that fundamentals usually drive long-term market outcomes, the company is worth looking at. In this article, we decided to focus on tripla's ROE.
Return on Equity or ROE is a test of how effectively a company is growing its value and managing investors’ money. In simpler terms, it measures the profitability of a company in relation to shareholder's equity.
See our latest analysis for tripla
How Is ROE Calculated?
Return on equity can be calculated by using the formula:
Return on Equity = Net Profit (from continuing operations) ÷ Shareholders' Equity
So, based on the above formula, the ROE for tripla is:
9.4% = JP¥123m ÷ JP¥1.3b (Based on the trailing twelve months to January 2024).
The 'return' is the profit over the last twelve months. One way to conceptualize this is that for each ¥1 of shareholders' capital it has, the company made ¥0.09 in profit.
What Has ROE Got To Do With Earnings Growth?
So far, we've learned that ROE is a measure of a company's profitability. We now need to evaluate how much profit the company reinvests or "retains" for future growth which then gives us an idea about the growth potential of the company. Assuming everything else remains unchanged, the higher the ROE and profit retention, the higher the growth rate of a company compared to companies that don't necessarily bear these characteristics.
tripla's Earnings Growth And 9.4% ROE
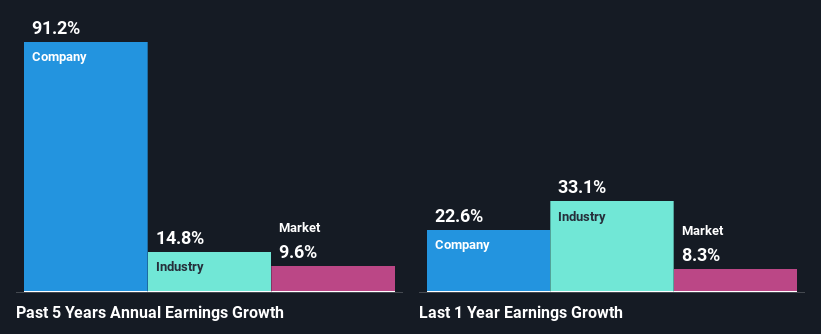
At first glance, tripla seems to have a decent ROE. Even when compared to the industry average of 11% the company's ROE looks quite decent. This probably goes some way in explaining tripla's significant 91% net income growth over the past five years amongst other factors. We reckon that there could also be other factors at play here. For example, it is possible that the company's management has made some good strategic decisions, or that the company has a low payout ratio.
As a next step, we compared tripla's net income growth with the industry, and pleasingly, we found that the growth seen by the company is higher than the average industry growth of 15%.
Earnings growth is an important metric to consider when valuing a stock. The investor should try to establish if the expected growth or decline in earnings, whichever the case may be, is priced in. By doing so, they will have an idea if the stock is headed into clear blue waters or if swampy waters await. One good indicator of expected earnings growth is the P/E ratio which determines the price the market is willing to pay for a stock based on its earnings prospects. So, you may want to check if tripla is trading on a high P/E or a low P/E, relative to its industry.
Is tripla Efficiently Re-investing Its Profits?
tripla doesn't pay any regular dividends currently which essentially means that it has been reinvesting all of its profits into the business. This definitely contributes to the high earnings growth number that we discussed above.
Summary
Overall, we are quite pleased with tripla's performance. Specifically, we like that the company is reinvesting a huge chunk of its profits at a high rate of return. This of course has caused the company to see substantial growth in its earnings. If the company continues to grow its earnings the way it has, that could have a positive impact on its share price given how earnings per share influence long-term share prices. Not to forget, share price outcomes are also dependent on the potential risks a company may face. So it is important for investors to be aware of the risks involved in the business. To know the 3 risks we have identified for tripla visit our risks dashboard for free.
Valuation is complex, but we're helping make it simple.
Find out whether tripla is potentially over or undervalued by checking out our comprehensive analysis, which includes fair value estimates, risks and warnings, dividends, insider transactions and financial health.
View the Free AnalysisHave feedback on this article? Concerned about the content? Get in touch with us directly. Alternatively, email editorial-team (at) simplywallst.com.
This article by Simply Wall St is general in nature. We provide commentary based on historical data and analyst forecasts only using an unbiased methodology and our articles are not intended to be financial advice. It does not constitute a recommendation to buy or sell any stock, and does not take account of your objectives, or your financial situation. We aim to bring you long-term focused analysis driven by fundamental data. Note that our analysis may not factor in the latest price-sensitive company announcements or qualitative material. Simply Wall St has no position in any stocks mentioned.
About TSE:5136
tripla
tripla Co., Ltd. engages in travel agency and internet service business.
Adequate balance sheet and slightly overvalued.
