Metaplanet (TSE:3350) stock has seen quite a shift lately as investors digest its recent performance numbers and overall market trends. A look at how shares have moved reveals some interesting dynamics that are worth unpacking.
Metaplanet’s share price has taken investors on a wild ride over the past year, with short-term momentum cooling off after a sharp run-up. However, the one-year total shareholder return still sits at an impressive 33.5%. Despite recent drops, those holding on for several years have seen standout gains, thanks to a staggering 643.8% total return over three years and 475.8% over five years. This continues to draw attention to the company’s potential and evolving risk profile in a rapidly shifting market.
With robust past returns and a strong growth record, the real question now is whether Metaplanet shares are trading below their true value, or if the market already reflects all of the company’s future potential and prospects.
Advertisement
Price-to-Earnings of 20.1x: Is it justified?
With Metaplanet trading at a price-to-earnings (P/E) ratio of 20.1x versus a recent close of ¥357, investors are paying a premium relative to peer averages. This signals that higher growth expectations are included in the price.
The P/E ratio tells us how much the market is willing to pay for each yen of current earnings. For Metaplanet, this figure suggests investors have optimism about the company’s future earnings potential, especially after a recent transition to profitability.
However, the current P/E of 20.1x actually sits below the broader Hospitality industry average of 23.2x. This makes Metaplanet comparatively attractive within its sector. Furthermore, when matched against our regression-based fair P/E estimate of 57x, there appears to be considerable headroom for valuation to rise if expectations are met or exceeded.
However, sharp revenue swings or unexpected profit declines could quickly temper optimism. This reminds investors that past outperformance does not guarantee future results.
Another View: Discounted Cash Flow Model Weighs In
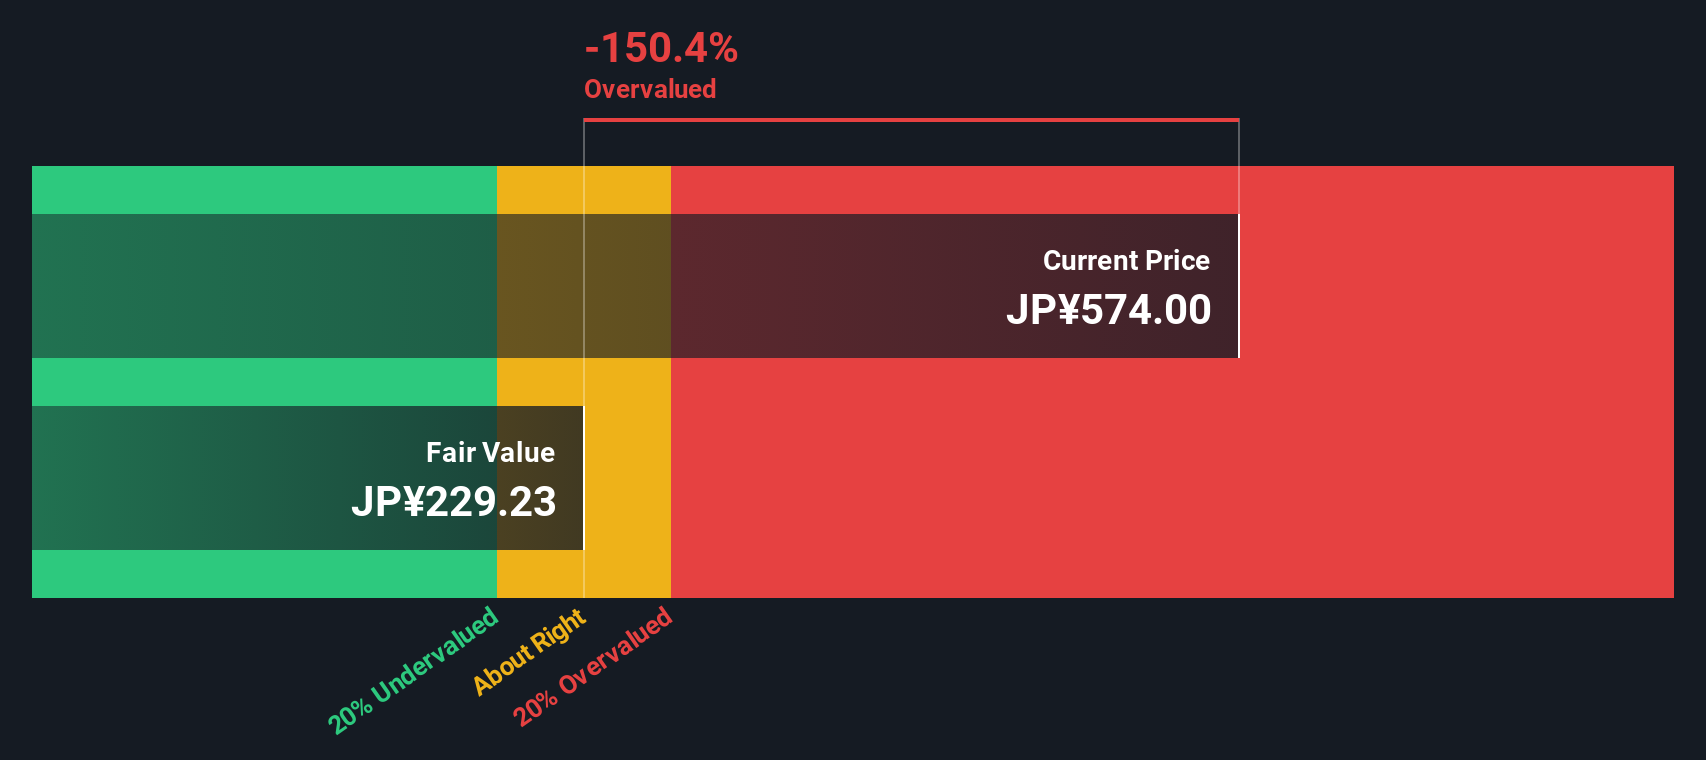
While the price-to-earnings ratio paints a story of optimism, our DCF model takes a much more conservative stance. Based on this approach, Metaplanet’s current share price of ¥357 sits well above our estimate of fair value at ¥35.7. This raises new questions about the true scope for upside.
Simply Wall St performs a discounted cash flow (DCF) on every stock in the world every day (check out Metaplanet for example). We show the entire calculation in full. You can track the result in your watchlist or portfolio and be alerted when this changes, or use our stock screener to discover 927 undervalued stocks based on their cash flows. If you save a screener we even alert you when new companies match - so you never miss a potential opportunity.
Build Your Own Metaplanet Narrative
Keep in mind, if you have a different perspective or want to dig into the numbers yourself, you can easily craft your own story in just a few minutes with Do it your way.
Capture the momentum in artificial intelligence by jumping into these 26 AI penny stocks driving game-changing innovations and reshaping entire industries.
This article by Simply Wall St is general in nature. We provide commentary based on historical data
and analyst forecasts only using an unbiased methodology and our articles are not intended to be financial advice. It does not constitute a recommendation to buy or sell any stock, and does not take account of your objectives, or your
financial situation. We aim to bring you long-term focused analysis driven by fundamental data.
Note that our analysis may not factor in the latest price-sensitive company announcements or qualitative material.
Simply Wall St has no position in any stocks mentioned.
New: Manage All Your Stock Portfolios in One Place
We've created the ultimate portfolio companion for stock investors, and it's free.
• Connect an unlimited number of Portfolios and see your total in one currency • Be alerted to new Warning Signs or Risks via email or mobile • Track the Fair Value of your stocks