
Advertisement
Optimistic Investors Push Marushohotta Co.,Ltd. (TSE:8105) Shares Up 25% But Growth Is Lacking
Marushohotta Co.,Ltd. (TSE:8105) shares have continued their recent momentum with a 25% gain in the last month alone. This latest share price bounce rounds out a remarkable 1,432% gain over the last twelve months.
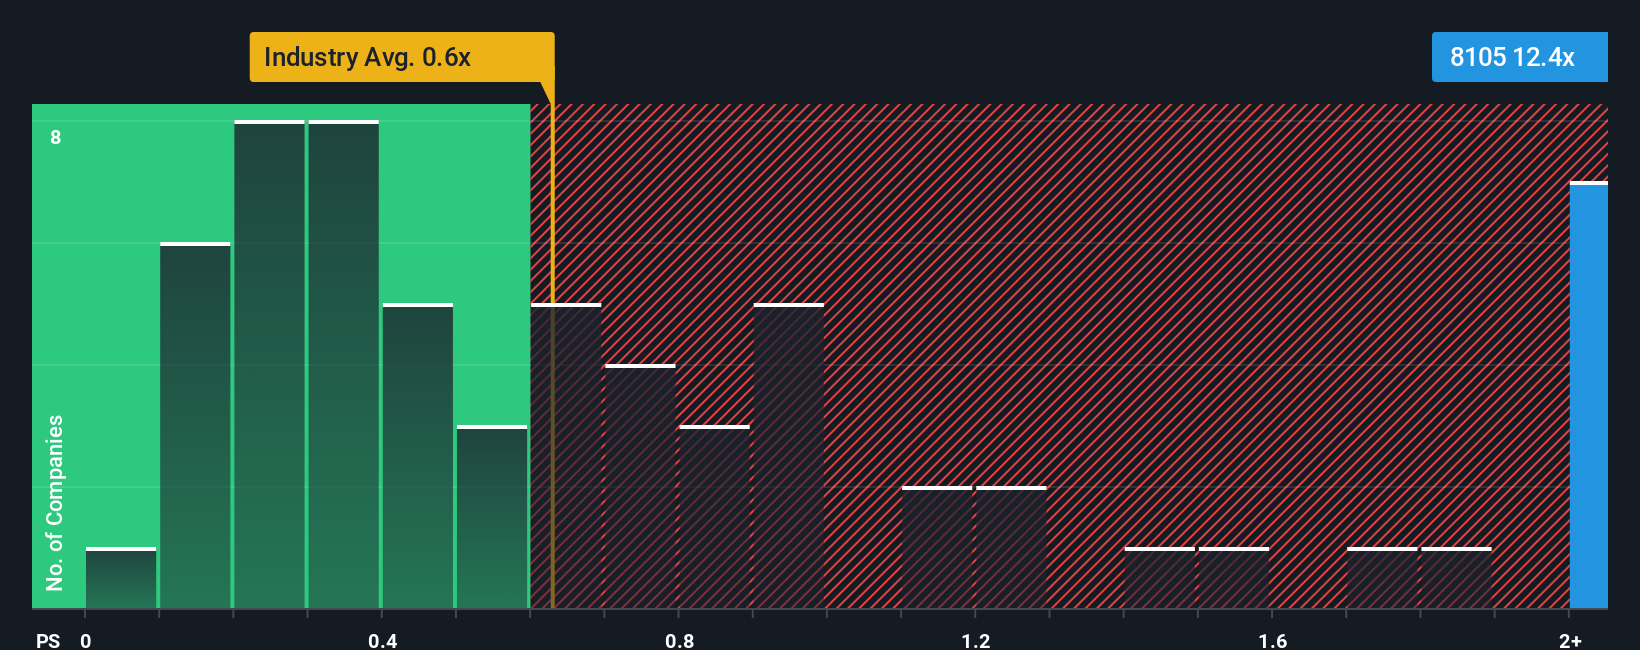
After such a large jump in price, when almost half of the companies in Japan's Luxury industry have price-to-sales ratios (or "P/S") below 0.6x, you may consider MarushohottaLtd as a stock not worth researching with its 12.4x P/S ratio. Nonetheless, we'd need to dig a little deeper to determine if there is a rational basis for the highly elevated P/S.
Check out our latest analysis for MarushohottaLtd
How MarushohottaLtd Has Been Performing
As an illustration, revenue has deteriorated at MarushohottaLtd over the last year, which is not ideal at all. It might be that many expect the company to still outplay most other companies over the coming period, which has kept the P/S from collapsing. If not, then existing shareholders may be quite nervous about the viability of the share price.
Want the full picture on earnings, revenue and cash flow for the company? Then our free report on MarushohottaLtd will help you shine a light on its historical performance.Do Revenue Forecasts Match The High P/S Ratio?
There's an inherent assumption that a company should far outperform the industry for P/S ratios like MarushohottaLtd's to be considered reasonable.
In reviewing the last year of financials, we were disheartened to see the company's revenues fell to the tune of 14%. The last three years don't look nice either as the company has shrunk revenue by 19% in aggregate. Therefore, it's fair to say the revenue growth recently has been undesirable for the company.
Comparing that to the industry, which is predicted to deliver 10% growth in the next 12 months, the company's downward momentum based on recent medium-term revenue results is a sobering picture.
With this in mind, we find it worrying that MarushohottaLtd's P/S exceeds that of its industry peers. Apparently many investors in the company are way more bullish than recent times would indicate and aren't willing to let go of their stock at any price. Only the boldest would assume these prices are sustainable as a continuation of recent revenue trends is likely to weigh heavily on the share price eventually.
What Does MarushohottaLtd's P/S Mean For Investors?
The strong share price surge has lead to MarushohottaLtd's P/S soaring as well. Typically, we'd caution against reading too much into price-to-sales ratios when settling on investment decisions, though it can reveal plenty about what other market participants think about the company.
We've established that MarushohottaLtd currently trades on a much higher than expected P/S since its recent revenues have been in decline over the medium-term. When we see revenue heading backwards and underperforming the industry forecasts, we feel the possibility of the share price declining is very real, bringing the P/S back into the realm of reasonability. Should recent medium-term revenue trends persist, it would pose a significant risk to existing shareholders' investments and prospective investors will have a hard time accepting the current value of the stock.
It's always necessary to consider the ever-present spectre of investment risk. We've identified 2 warning signs with MarushohottaLtd, and understanding these should be part of your investment process.
Of course, profitable companies with a history of great earnings growth are generally safer bets. So you may wish to see this free collection of other companies that have reasonable P/E ratios and have grown earnings strongly.
New: Manage All Your Stock Portfolios in One Place
We've created the ultimate portfolio companion for stock investors, and it's free.
• Connect an unlimited number of Portfolios and see your total in one currency
• Be alerted to new Warning Signs or Risks via email or mobile
• Track the Fair Value of your stocks
Have feedback on this article? Concerned about the content? Get in touch with us directly. Alternatively, email editorial-team (at) simplywallst.com.
This article by Simply Wall St is general in nature. We provide commentary based on historical data and analyst forecasts only using an unbiased methodology and our articles are not intended to be financial advice. It does not constitute a recommendation to buy or sell any stock, and does not take account of your objectives, or your financial situation. We aim to bring you long-term focused analysis driven by fundamental data. Note that our analysis may not factor in the latest price-sensitive company announcements or qualitative material. Simply Wall St has no position in any stocks mentioned.
About TSE:8105
MarushohottaLtd
Engages in the manufacture and wholesale of women's clothing products in Japan.
Excellent balance sheet with very low risk.
Market Insights

Advertisement
Community Narratives
The company that turned a verb into a global necessity and basically runs the modern internet, digital ads, smartphones, maps, and AI.
Fair Value US$300.00|5.2% undervalued
OS
Community Contributor
Flowers Foods Pays A Fair Price For Health
Fair Value US$16.12|24.9% undervalued
NV
Community Contributor
TMX Group will thrive with 33.3% profit margin and enduring market moat
Fair Value CA$49.90|3.3% overvalued
LI
Community Contributor
The "Molecular Pencil": Why Beam's Technology is Built to Win
Fair Value US$65.01|64.5% undervalued
DA
Community Contributor