
Advertisement
There's Reason For Concern Over Nihon Seimitsu Co., Ltd.'s (TSE:7771) Massive 27% Price Jump
Nihon Seimitsu Co., Ltd. (TSE:7771) shareholders would be excited to see that the share price has had a great month, posting a 27% gain and recovering from prior weakness. Longer-term shareholders would be thankful for the recovery in the share price since it's now virtually flat for the year after the recent bounce.
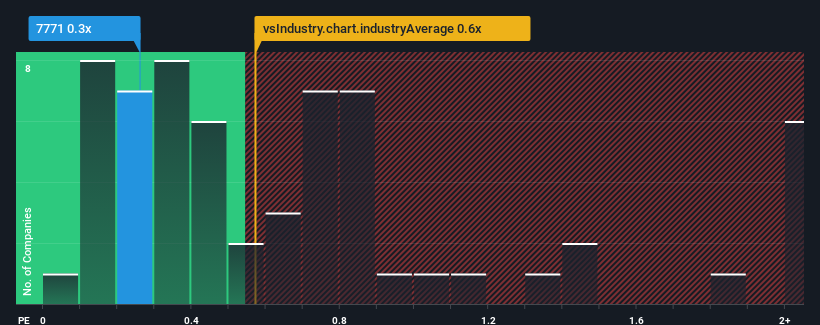
Although its price has surged higher, there still wouldn't be many who think Nihon Seimitsu's price-to-sales (or "P/S") ratio of 0.3x is worth a mention when the median P/S in Japan's Luxury industry is similar at about 0.6x. However, investors might be overlooking a clear opportunity or potential setback if there is no rational basis for the P/S.
We've discovered 3 warning signs about Nihon Seimitsu. View them for free.See our latest analysis for Nihon Seimitsu
What Does Nihon Seimitsu's Recent Performance Look Like?
The revenue growth achieved at Nihon Seimitsu over the last year would be more than acceptable for most companies. Perhaps the market is expecting future revenue performance to only keep up with the broader industry, which has keeping the P/S in line with expectations. If that doesn't eventuate, then existing shareholders probably aren't too pessimistic about the future direction of the share price.
We don't have analyst forecasts, but you can see how recent trends are setting up the company for the future by checking out our free report on Nihon Seimitsu's earnings, revenue and cash flow.What Are Revenue Growth Metrics Telling Us About The P/S?
In order to justify its P/S ratio, Nihon Seimitsu would need to produce growth that's similar to the industry.
Taking a look back first, we see that the company managed to grow revenues by a handy 8.9% last year. Revenue has also lifted 27% in aggregate from three years ago, partly thanks to the last 12 months of growth. Accordingly, shareholders would have probably been satisfied with the medium-term rates of revenue growth.
This is in contrast to the rest of the industry, which is expected to grow by 12% over the next year, materially higher than the company's recent medium-term annualised growth rates.
With this information, we find it interesting that Nihon Seimitsu is trading at a fairly similar P/S compared to the industry. It seems most investors are ignoring the fairly limited recent growth rates and are willing to pay up for exposure to the stock. They may be setting themselves up for future disappointment if the P/S falls to levels more in line with recent growth rates.
What We Can Learn From Nihon Seimitsu's P/S?
Its shares have lifted substantially and now Nihon Seimitsu's P/S is back within range of the industry median. While the price-to-sales ratio shouldn't be the defining factor in whether you buy a stock or not, it's quite a capable barometer of revenue expectations.
We've established that Nihon Seimitsu's average P/S is a bit surprising since its recent three-year growth is lower than the wider industry forecast. Right now we are uncomfortable with the P/S as this revenue performance isn't likely to support a more positive sentiment for long. Unless there is a significant improvement in the company's medium-term performance, it will be difficult to prevent the P/S ratio from declining to a more reasonable level.
Having said that, be aware Nihon Seimitsu is showing 3 warning signs in our investment analysis, and 1 of those is a bit unpleasant.
If these risks are making you reconsider your opinion on Nihon Seimitsu, explore our interactive list of high quality stocks to get an idea of what else is out there.
Valuation is complex, but we're here to simplify it.
Discover if Nihon Seimitsu might be undervalued or overvalued with our detailed analysis, featuring fair value estimates, potential risks, dividends, insider trades, and its financial condition.
Access Free AnalysisHave feedback on this article? Concerned about the content? Get in touch with us directly. Alternatively, email editorial-team (at) simplywallst.com.
This article by Simply Wall St is general in nature. We provide commentary based on historical data and analyst forecasts only using an unbiased methodology and our articles are not intended to be financial advice. It does not constitute a recommendation to buy or sell any stock, and does not take account of your objectives, or your financial situation. We aim to bring you long-term focused analysis driven by fundamental data. Note that our analysis may not factor in the latest price-sensitive company announcements or qualitative material. Simply Wall St has no position in any stocks mentioned.
About TSE:7771
Nihon Seimitsu
Manufactures and sells watch bands and exterior parts, spectacle frames, and other products in Japan.
Solid track record with adequate balance sheet.
Market Insights

Advertisement
Community Narratives
MicroVision will explode future revenue by 380.37% with a vision towards success
Fair Value US$60.00|98.4% undervalued
TH
Community Contributor
The Indispensable Artery for a New North American Economy
Fair Value CA$132.87|1.3% undervalued
TI
Community Contributor