Advertisement
- Japan
- /
- Commercial Services
- /
- TSE:7994
Okamura (TSE:7994): Assessing Valuation After Profit Forecast Cut Despite Sales Growth

Simply Wall St
Reviewed by Simply Wall St
Okamura (TSE:7994) reported higher sales for the recent half-year but lowered its full-year profit outlook, citing increased personnel costs and weaker performance in certain business segments. The revised guidance highlights profitability pressures ahead.
See our latest analysis for Okamura.
Okamura’s recent downward revision to its annual profit outlook comes after strong share price momentum earlier in the year, with a 14.8% year-to-date gain. Even with near-term pressure around costs and some segments, long-term investors have seen a 20.3% total return over 12 months and an impressive 215.6% over five years. This suggests confidence in underlying growth and resilience despite some short-term headwinds.
If you’re interested in uncovering other companies with potential, this is a great moment to broaden your horizons and discover fast growing stocks with high insider ownership
With strong share gains but a recent cut to profit forecasts, the key question is whether Okamura’s current price reflects all future risks and growth, or if investors are looking at a rare buying opportunity.
Price-to-Earnings of 11.1x: Is it justified?
Okamura is trading at a price-to-earnings ratio of 11.1x, which stands out as a bargain compared to industry peers. With a last close price of ¥2304, the stock currently looks attractively valued considering recent performance and outlook.
The price-to-earnings (P/E) ratio represents how much investors are willing to pay for every ¥1 of Okamura's earnings. It is a crucial measure for established companies like Okamura, reflecting market expectations for future growth and returns. A lower P/E can indicate an undervalued stock or limited expected growth.
This multiple is considerably lower than the peer average of 14.5x and the broader Commercial Services industry average of 12.8x. This underscores Okamura's strong relative value. The estimated fair P/E ratio is even higher at 17.8x, suggesting ample room for market repricing if fundamentals support it.
Explore the SWS fair ratio for Okamura
Result: Price-to-Earnings of 11.1x (UNDERVALUED)
However, persistent cost pressures and underperformance in some business segments could limit upside and challenge Okamura’s ability to sustain this valuation advantage.
Find out about the key risks to this Okamura narrative.
Another View: What Does the SWS DCF Model Say?
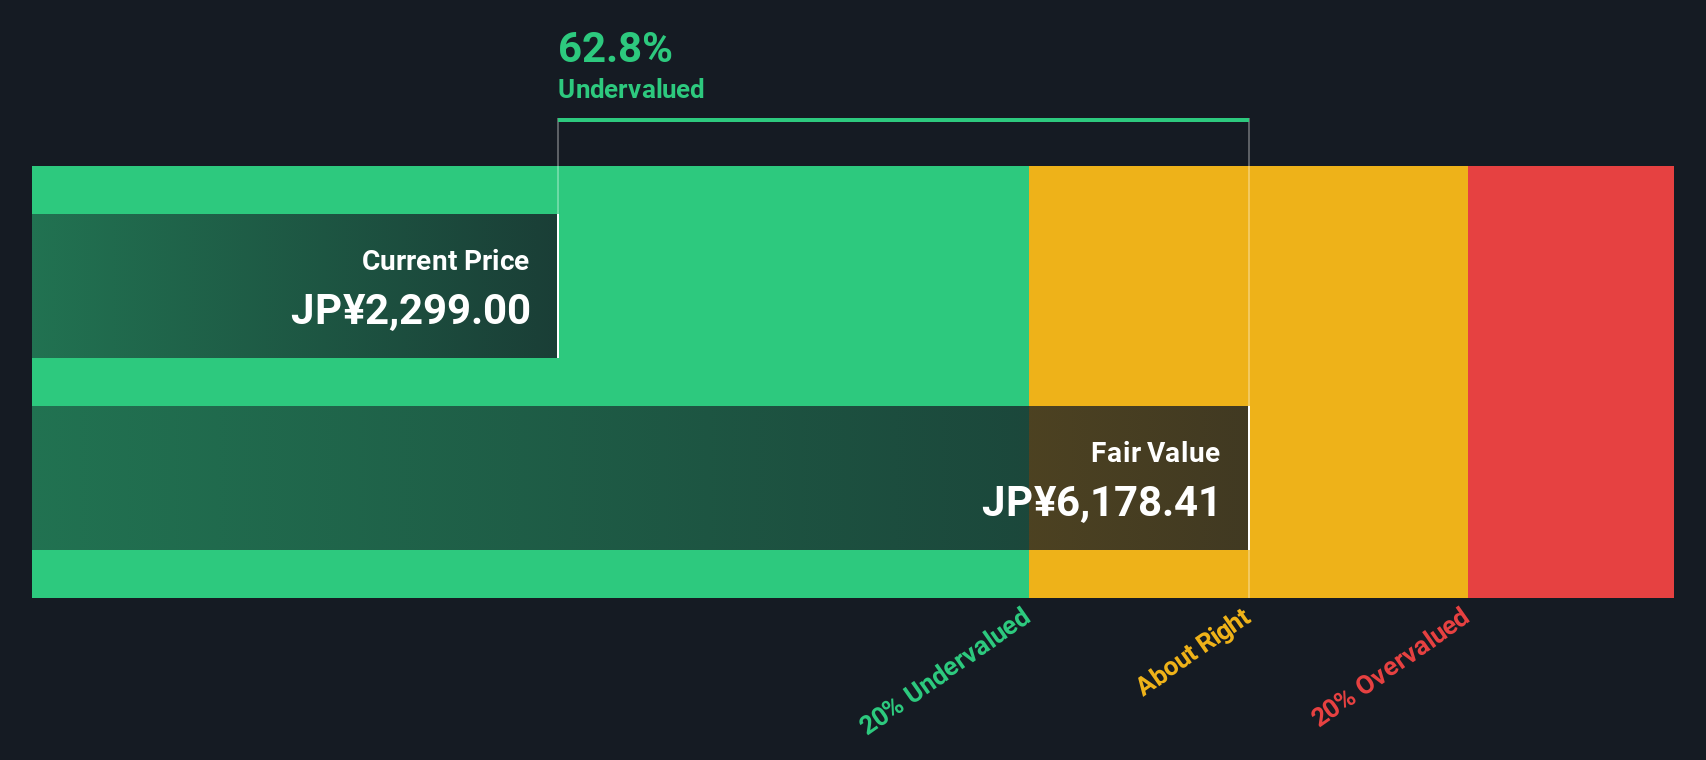
While Okamura’s relatively low price-to-earnings ratio suggests good value, the SWS DCF model goes even further, estimating fair value at ¥6411.19. This represents about 64% above the current price of ¥2304. This model indicates even greater upside. Are the market’s concerns truly weighing too heavily?
Look into how the SWS DCF model arrives at its fair value.
Simply Wall St performs a discounted cash flow (DCF) on every stock in the world every day (check out Okamura for example). We show the entire calculation in full. You can track the result in your watchlist or portfolio and be alerted when this changes, or use our stock screener to discover 870 undervalued stocks based on their cash flows. If you save a screener we even alert you when new companies match - so you never miss a potential opportunity.
Build Your Own Okamura Narrative
If you see things differently, or want to dig deeper into the numbers yourself, take a few minutes to build your own perspective and Do it your way.
A great starting point for your Okamura research is our analysis highlighting 3 key rewards and 1 important warning sign that could impact your investment decision.
Looking for more investment ideas?
If you want to get ahead of the curve, don’t miss out on smart stock picks beyond Okamura using the Simply Wall Street Screener. Opportunities abound for sharper investors.
- Boost your portfolio’s income potential by checking out these 16 dividend stocks with yields > 3% that offer solid yields above 3 percent and a proven commitment to payouts.
- Jump in early on the powerful trends shaping tomorrow by uncovering these 24 AI penny stocks at the cutting edge of artificial intelligence innovation.
- Capitalize on hidden opportunities by scanning these 870 undervalued stocks based on cash flows that the market is currently pricing below their true worth based on cash flows.
This article by Simply Wall St is general in nature. We provide commentary based on historical data and analyst forecasts only using an unbiased methodology and our articles are not intended to be financial advice. It does not constitute a recommendation to buy or sell any stock, and does not take account of your objectives, or your financial situation. We aim to bring you long-term focused analysis driven by fundamental data. Note that our analysis may not factor in the latest price-sensitive company announcements or qualitative material. Simply Wall St has no position in any stocks mentioned.
New: AI Stock Screener & Alerts
Our new AI Stock Screener scans the market every day to uncover opportunities.
• Dividend Powerhouses (3%+ Yield)
• Undervalued Small Caps with Insider Buying
• High growth Tech and AI Companies
Or build your own from over 50 metrics.
Have feedback on this article? Concerned about the content? Get in touch with us directly. Alternatively, email editorial-team@simplywallst.com
About TSE:7994
Okamura
Engages in office furniture, store displays, and material handling systems businesses in Japan.
Undervalued with excellent balance sheet and pays a dividend.
Similar Companies
Market Insights

Advertisement
Community Narratives
The company that turned a verb into a global necessity and basically runs the modern internet, digital ads, smartphones, maps, and AI.
Fair Value US$300.00|7.1% undervalued
OS
Community Contributor
Flowers Foods Pays A Fair Price For Health
Fair Value US$16.12|26.4% undervalued
NV
Community Contributor
TMX Group will thrive with 33.3% profit margin and enduring market moat
Fair Value CA$49.90|0.8% overvalued
LI
Community Contributor
The "Molecular Pencil": Why Beam's Technology is Built to Win
Fair Value US$65.01|65.8% undervalued
DA
Community Contributor