Stock Analysis
- Japan
- /
- Professional Services
- /
- TSE:2181
Persol Holdings Co.,Ltd. (TSE:2181) is definitely on the radar of institutional investors who own 46% of the company


Key Insights
- Significantly high institutional ownership implies Persol HoldingsLtd's stock price is sensitive to their trading actions
- The top 11 shareholders own 51% of the company
- Insider ownership in Persol HoldingsLtd is 12%
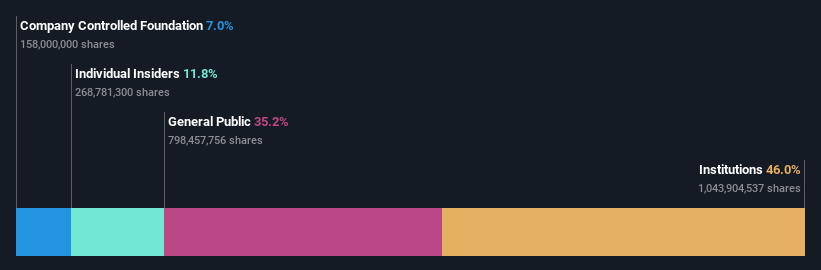
A look at the shareholders of Persol Holdings Co.,Ltd. (TSE:2181) can tell us which group is most powerful. With 46% stake, institutions possess the maximum shares in the company. Put another way, the group faces the maximum upside potential (or downside risk).
Given the vast amount of money and research capacities at their disposal, institutional ownership tends to carry a lot of weight, especially with individual investors. Therefore, a good portion of institutional money invested in the company is usually a huge vote of confidence on its future.
In the chart below, we zoom in on the different ownership groups of Persol HoldingsLtd.
Check out our latest analysis for Persol HoldingsLtd
What Does The Institutional Ownership Tell Us About Persol HoldingsLtd?
Many institutions measure their performance against an index that approximates the local market. So they usually pay more attention to companies that are included in major indices.
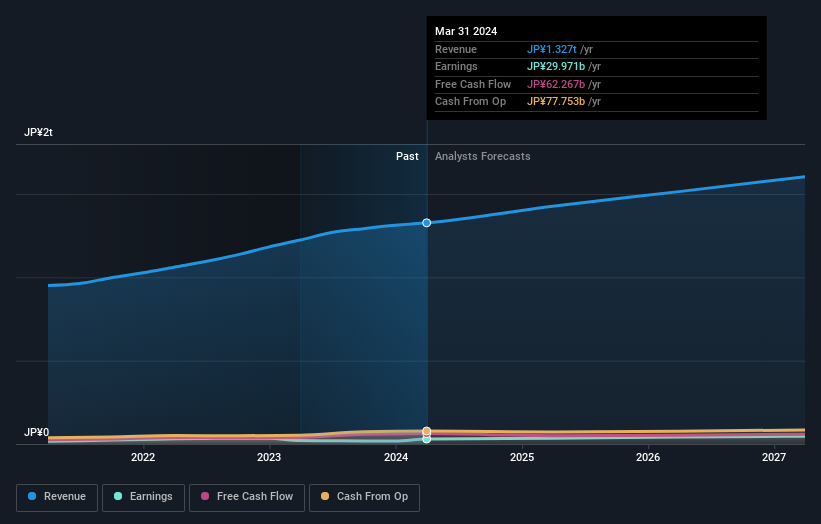
Persol HoldingsLtd already has institutions on the share registry. Indeed, they own a respectable stake in the company. This implies the analysts working for those institutions have looked at the stock and they like it. But just like anyone else, they could be wrong. If multiple institutions change their view on a stock at the same time, you could see the share price drop fast. It's therefore worth looking at Persol HoldingsLtd's earnings history below. Of course, the future is what really matters.
Hedge funds don't have many shares in Persol HoldingsLtd. The company's largest shareholder is Yoshiko Shinohara, with ownership of 12%. In comparison, the second and third largest shareholders hold about 9.3% and 7.0% of the stock.
A closer look at our ownership figures suggests that the top 11 shareholders have a combined ownership of 51% implying that no single shareholder has a majority.
While it makes sense to study institutional ownership data for a company, it also makes sense to study analyst sentiments to know which way the wind is blowing. There are a reasonable number of analysts covering the stock, so it might be useful to find out their aggregate view on the future.
Insider Ownership Of Persol HoldingsLtd
While the precise definition of an insider can be subjective, almost everyone considers board members to be insiders. The company management answer to the board and the latter should represent the interests of shareholders. Notably, sometimes top-level managers are on the board themselves.
Most consider insider ownership a positive because it can indicate the board is well aligned with other shareholders. However, on some occasions too much power is concentrated within this group.
Our information suggests that insiders maintain a significant holding in Persol Holdings Co.,Ltd.. It is very interesting to see that insiders have a meaningful JP¥68b stake in this JP¥572b business. Most would say this shows a good degree of alignment with shareholders, especially in a company of this size. You can click here to see if those insiders have been buying or selling.
General Public Ownership
The general public-- including retail investors -- own 35% stake in the company, and hence can't easily be ignored. This size of ownership, while considerable, may not be enough to change company policy if the decision is not in sync with other large shareholders.
Next Steps:
It's always worth thinking about the different groups who own shares in a company. But to understand Persol HoldingsLtd better, we need to consider many other factors. Case in point: We've spotted 1 warning sign for Persol HoldingsLtd you should be aware of.
If you would prefer discover what analysts are predicting in terms of future growth, do not miss this free report on analyst forecasts.
NB: Figures in this article are calculated using data from the last twelve months, which refer to the 12-month period ending on the last date of the month the financial statement is dated. This may not be consistent with full year annual report figures.
New: Manage All Your Stock Portfolios in One Place
We've created the ultimate portfolio companion for stock investors, and it's free.
• Connect an unlimited number of Portfolios and see your total in one currency
• Be alerted to new Warning Signs or Risks via email or mobile
• Track the Fair Value of your stocks
Have feedback on this article? Concerned about the content? Get in touch with us directly. Alternatively, email editorial-team (at) simplywallst.com.
This article by Simply Wall St is general in nature. We provide commentary based on historical data and analyst forecasts only using an unbiased methodology and our articles are not intended to be financial advice. It does not constitute a recommendation to buy or sell any stock, and does not take account of your objectives, or your financial situation. We aim to bring you long-term focused analysis driven by fundamental data. Note that our analysis may not factor in the latest price-sensitive company announcements or qualitative material. Simply Wall St has no position in any stocks mentioned.
Have feedback on this article? Concerned about the content? Get in touch with us directly. Alternatively, email editorial-team@simplywallst.com
About TSE:2181
Persol HoldingsLtd
Provides human resource services under the PERSOL brand worldwide.
Flawless balance sheet with solid track record and pays a dividend.
