Will Weakness in Matsuya R&D Co.,Ltd's (TSE:7317) Stock Prove Temporary Given Strong Fundamentals?


With its stock down 30% over the past three months, it is easy to disregard Matsuya R&DLtd (TSE:7317). But if you pay close attention, you might gather that its strong financials could mean that the stock could potentially see an increase in value in the long-term, given how markets usually reward companies with good financial health. Particularly, we will be paying attention to Matsuya R&DLtd's ROE today.
Return on equity or ROE is a key measure used to assess how efficiently a company's management is utilizing the company's capital. In simpler terms, it measures the profitability of a company in relation to shareholder's equity.
Check out our latest analysis for Matsuya R&DLtd
How Do You Calculate Return On Equity?
The formula for ROE is:
Return on Equity = Net Profit (from continuing operations) ÷ Shareholders' Equity
So, based on the above formula, the ROE for Matsuya R&DLtd is:
18% = JP¥953m ÷ JP¥5.2b (Based on the trailing twelve months to March 2024).
The 'return' is the amount earned after tax over the last twelve months. One way to conceptualize this is that for each ¥1 of shareholders' capital it has, the company made ¥0.18 in profit.
Why Is ROE Important For Earnings Growth?
We have already established that ROE serves as an efficient profit-generating gauge for a company's future earnings. We now need to evaluate how much profit the company reinvests or "retains" for future growth which then gives us an idea about the growth potential of the company. Assuming everything else remains unchanged, the higher the ROE and profit retention, the higher the growth rate of a company compared to companies that don't necessarily bear these characteristics.
Matsuya R&DLtd's Earnings Growth And 18% ROE
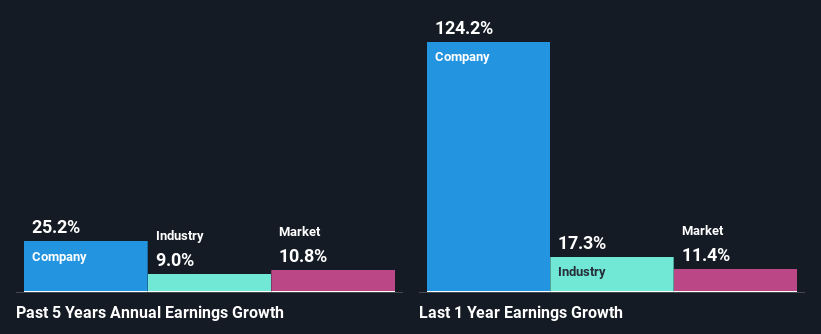
To begin with, Matsuya R&DLtd seems to have a respectable ROE. On comparing with the average industry ROE of 7.7% the company's ROE looks pretty remarkable. This probably laid the ground for Matsuya R&DLtd's significant 25% net income growth seen over the past five years. We believe that there might also be other aspects that are positively influencing the company's earnings growth. Such as - high earnings retention or an efficient management in place.
Next, on comparing with the industry net income growth, we found that Matsuya R&DLtd's growth is quite high when compared to the industry average growth of 9.0% in the same period, which is great to see.
Earnings growth is a huge factor in stock valuation. The investor should try to establish if the expected growth or decline in earnings, whichever the case may be, is priced in. Doing so will help them establish if the stock's future looks promising or ominous. If you're wondering about Matsuya R&DLtd's's valuation, check out this gauge of its price-to-earnings ratio, as compared to its industry.
Is Matsuya R&DLtd Making Efficient Use Of Its Profits?
Matsuya R&DLtd's ' three-year median payout ratio is on the lower side at 5.9% implying that it is retaining a higher percentage (94%) of its profits. This suggests that the management is reinvesting most of the profits to grow the business as evidenced by the growth seen by the company.
Besides, Matsuya R&DLtd has been paying dividends over a period of three years. This shows that the company is committed to sharing profits with its shareholders.
Conclusion
In total, we are pretty happy with Matsuya R&DLtd's performance. In particular, it's great to see that the company is investing heavily into its business and along with a high rate of return, that has resulted in a sizeable growth in its earnings. If the company continues to grow its earnings the way it has, that could have a positive impact on its share price given how earnings per share influence long-term share prices. Not to forget, share price outcomes are also dependent on the potential risks a company may face. So it is important for investors to be aware of the risks involved in the business. To know the 2 risks we have identified for Matsuya R&DLtd visit our risks dashboard for free.
New: Manage All Your Stock Portfolios in One Place
We've created the ultimate portfolio companion for stock investors, and it's free.
• Connect an unlimited number of Portfolios and see your total in one currency
• Be alerted to new Warning Signs or Risks via email or mobile
• Track the Fair Value of your stocks
Have feedback on this article? Concerned about the content? Get in touch with us directly. Alternatively, email editorial-team (at) simplywallst.com.
This article by Simply Wall St is general in nature. We provide commentary based on historical data and analyst forecasts only using an unbiased methodology and our articles are not intended to be financial advice. It does not constitute a recommendation to buy or sell any stock, and does not take account of your objectives, or your financial situation. We aim to bring you long-term focused analysis driven by fundamental data. Note that our analysis may not factor in the latest price-sensitive company announcements or qualitative material. Simply Wall St has no position in any stocks mentioned.
Have feedback on this article? Concerned about the content? Get in touch with us directly. Alternatively, email editorial-team@simplywallst.com
About TSE:7317
Matsuya R&DLtd
Develops, manufactures, and sells stitching systems for automobile safety devices in Japan.
Proven track record with adequate balance sheet.
