- Japan
- /
- Construction
- /
- TSE:6540
Declining Stock and Decent Financials: Is The Market Wrong About Semba Corporation (TSE:6540)?


With its stock down 20% over the past three months, it is easy to disregard Semba (TSE:6540). However, the company's fundamentals look pretty decent, and long-term financials are usually aligned with future market price movements. Specifically, we decided to study Semba's ROE in this article.
Return on Equity or ROE is a test of how effectively a company is growing its value and managing investors’ money. In other words, it is a profitability ratio which measures the rate of return on the capital provided by the company's shareholders.
Check out our latest analysis for Semba
How Do You Calculate Return On Equity?
The formula for ROE is:
Return on Equity = Net Profit (from continuing operations) ÷ Shareholders' Equity
So, based on the above formula, the ROE for Semba is:
10% = JP¥1.2b ÷ JP¥12b (Based on the trailing twelve months to March 2024).
The 'return' is the income the business earned over the last year. Another way to think of that is that for every ¥1 worth of equity, the company was able to earn ¥0.10 in profit.
What Is The Relationship Between ROE And Earnings Growth?
We have already established that ROE serves as an efficient profit-generating gauge for a company's future earnings. We now need to evaluate how much profit the company reinvests or "retains" for future growth which then gives us an idea about the growth potential of the company. Assuming everything else remains unchanged, the higher the ROE and profit retention, the higher the growth rate of a company compared to companies that don't necessarily bear these characteristics.
Semba's Earnings Growth And 10% ROE
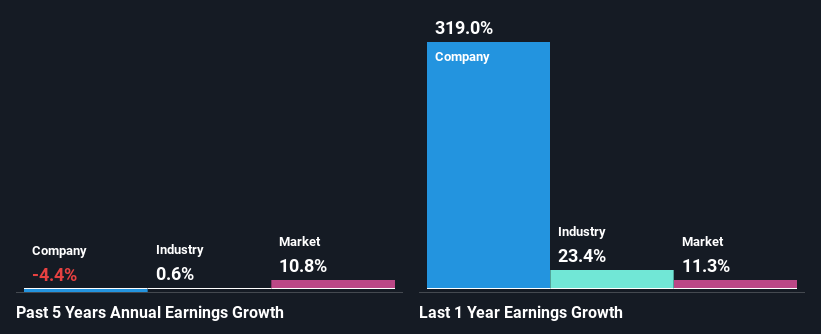
At first glance, Semba seems to have a decent ROE. Especially when compared to the industry average of 7.4% the company's ROE looks pretty impressive. Needless to say, we are quite surprised to see that Semba's net income shrunk at a rate of 4.4% over the past five years. Therefore, there might be some other aspects that could explain this. These include low earnings retention or poor allocation of capital.
However, when we compared Semba's growth with the industry we found that while the company's earnings have been shrinking, the industry has seen an earnings growth of 0.6% in the same period. This is quite worrisome.
Earnings growth is a huge factor in stock valuation. The investor should try to establish if the expected growth or decline in earnings, whichever the case may be, is priced in. This then helps them determine if the stock is placed for a bright or bleak future. If you're wondering about Semba's's valuation, check out this gauge of its price-to-earnings ratio, as compared to its industry.
Is Semba Efficiently Re-investing Its Profits?
Looking at its three-year median payout ratio of 47% (or a retention ratio of 53%) which is pretty normal, Semba's declining earnings is rather baffling as one would expect to see a fair bit of growth when a company is retaining a good portion of its profits. So there might be other factors at play here which could potentially be hampering growth. For example, the business has faced some headwinds.
Additionally, Semba has paid dividends over a period of seven years, which means that the company's management is rather focused on keeping up its dividend payments, regardless of the shrinking earnings.
Conclusion
On the whole, we do feel that Semba has some positive attributes. Yet, the low earnings growth is a bit concerning, especially given that the company has a high rate of return and is reinvesting ma huge portion of its profits. By the looks of it, there could be some other factors, not necessarily in control of the business, that's preventing growth. While we won't completely dismiss the company, what we would do, is try to ascertain how risky the business is to make a more informed decision around the company. You can see the 4 risks we have identified for Semba by visiting our risks dashboard for free on our platform here.
New: Manage All Your Stock Portfolios in One Place
We've created the ultimate portfolio companion for stock investors, and it's free.
• Connect an unlimited number of Portfolios and see your total in one currency
• Be alerted to new Warning Signs or Risks via email or mobile
• Track the Fair Value of your stocks
Have feedback on this article? Concerned about the content? Get in touch with us directly. Alternatively, email editorial-team (at) simplywallst.com.
This article by Simply Wall St is general in nature. We provide commentary based on historical data and analyst forecasts only using an unbiased methodology and our articles are not intended to be financial advice. It does not constitute a recommendation to buy or sell any stock, and does not take account of your objectives, or your financial situation. We aim to bring you long-term focused analysis driven by fundamental data. Note that our analysis may not factor in the latest price-sensitive company announcements or qualitative material. Simply Wall St has no position in any stocks mentioned.
Have feedback on this article? Concerned about the content? Get in touch with us directly. Alternatively, email editorial-team@simplywallst.com
About TSE:6540
Semba
Engages in the planning, design, construction, and supervision of commercial spaces in Japan and internationally.
Flawless balance sheet with proven track record.
