There's Been No Shortage Of Growth Recently For Maruyama Mfg's (TSE:6316) Returns On Capital


To find a multi-bagger stock, what are the underlying trends we should look for in a business? Ideally, a business will show two trends; firstly a growing return on capital employed (ROCE) and secondly, an increasing amount of capital employed. This shows us that it's a compounding machine, able to continually reinvest its earnings back into the business and generate higher returns. With that in mind, we've noticed some promising trends at Maruyama Mfg (TSE:6316) so let's look a bit deeper.
Understanding Return On Capital Employed (ROCE)
Just to clarify if you're unsure, ROCE is a metric for evaluating how much pre-tax income (in percentage terms) a company earns on the capital invested in its business. The formula for this calculation on Maruyama Mfg is:
Return on Capital Employed = Earnings Before Interest and Tax (EBIT) ÷ (Total Assets - Current Liabilities)
0.071 = JP¥1.6b ÷ (JP¥38b - JP¥16b) (Based on the trailing twelve months to March 2024).
Therefore, Maruyama Mfg has an ROCE of 7.1%. On its own, that's a low figure but it's around the 8.0% average generated by the Machinery industry.
View our latest analysis for Maruyama Mfg
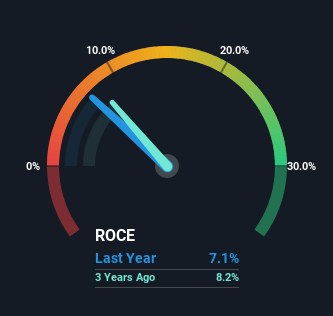
Historical performance is a great place to start when researching a stock so above you can see the gauge for Maruyama Mfg's ROCE against it's prior returns. If you're interested in investigating Maruyama Mfg's past further, check out this free graph covering Maruyama Mfg's past earnings, revenue and cash flow.
So How Is Maruyama Mfg's ROCE Trending?
Maruyama Mfg's ROCE growth is quite impressive. More specifically, while the company has kept capital employed relatively flat over the last five years, the ROCE has climbed 164% in that same time. So it's likely that the business is now reaping the full benefits of its past investments, since the capital employed hasn't changed considerably. It's worth looking deeper into this though because while it's great that the business is more efficient, it might also mean that going forward the areas to invest internally for the organic growth are lacking.
On a separate but related note, it's important to know that Maruyama Mfg has a current liabilities to total assets ratio of 42%, which we'd consider pretty high. This effectively means that suppliers (or short-term creditors) are funding a large portion of the business, so just be aware that this can introduce some elements of risk. While it's not necessarily a bad thing, it can be beneficial if this ratio is lower.
The Key Takeaway
To sum it up, Maruyama Mfg is collecting higher returns from the same amount of capital, and that's impressive. And investors seem to expect more of this going forward, since the stock has rewarded shareholders with a 95% return over the last five years. Therefore, we think it would be worth your time to check if these trends are going to continue.
On a separate note, we've found 2 warning signs for Maruyama Mfg you'll probably want to know about.
While Maruyama Mfg isn't earning the highest return, check out this free list of companies that are earning high returns on equity with solid balance sheets.
New: Manage All Your Stock Portfolios in One Place
We've created the ultimate portfolio companion for stock investors, and it's free.
• Connect an unlimited number of Portfolios and see your total in one currency
• Be alerted to new Warning Signs or Risks via email or mobile
• Track the Fair Value of your stocks
Have feedback on this article? Concerned about the content? Get in touch with us directly. Alternatively, email editorial-team (at) simplywallst.com.
This article by Simply Wall St is general in nature. We provide commentary based on historical data and analyst forecasts only using an unbiased methodology and our articles are not intended to be financial advice. It does not constitute a recommendation to buy or sell any stock, and does not take account of your objectives, or your financial situation. We aim to bring you long-term focused analysis driven by fundamental data. Note that our analysis may not factor in the latest price-sensitive company announcements or qualitative material. Simply Wall St has no position in any stocks mentioned.
Have feedback on this article? Concerned about the content? Get in touch with us directly. Alternatively, email editorial-team@simplywallst.com
About TSE:6316
Maruyama Mfg
Manufactures and sells machinery in Japan and internationally.
Excellent balance sheet average dividend payer.
