Glory (TSE:6457) shares have seen mild ups and downs recently, and many investors are watching to see how the company’s fundamentals may shape its next chapter. Over the past month, Glory’s stock has climbed 3%, even though it has lost ground during the past three months.
The past year has been a strong one for Glory, with a total shareholder return of nearly 58%, signaling growing confidence among investors. While momentum has slowed a bit over recent months, overall sentiment remains positive. The company’s fundamentals continue to attract attention.
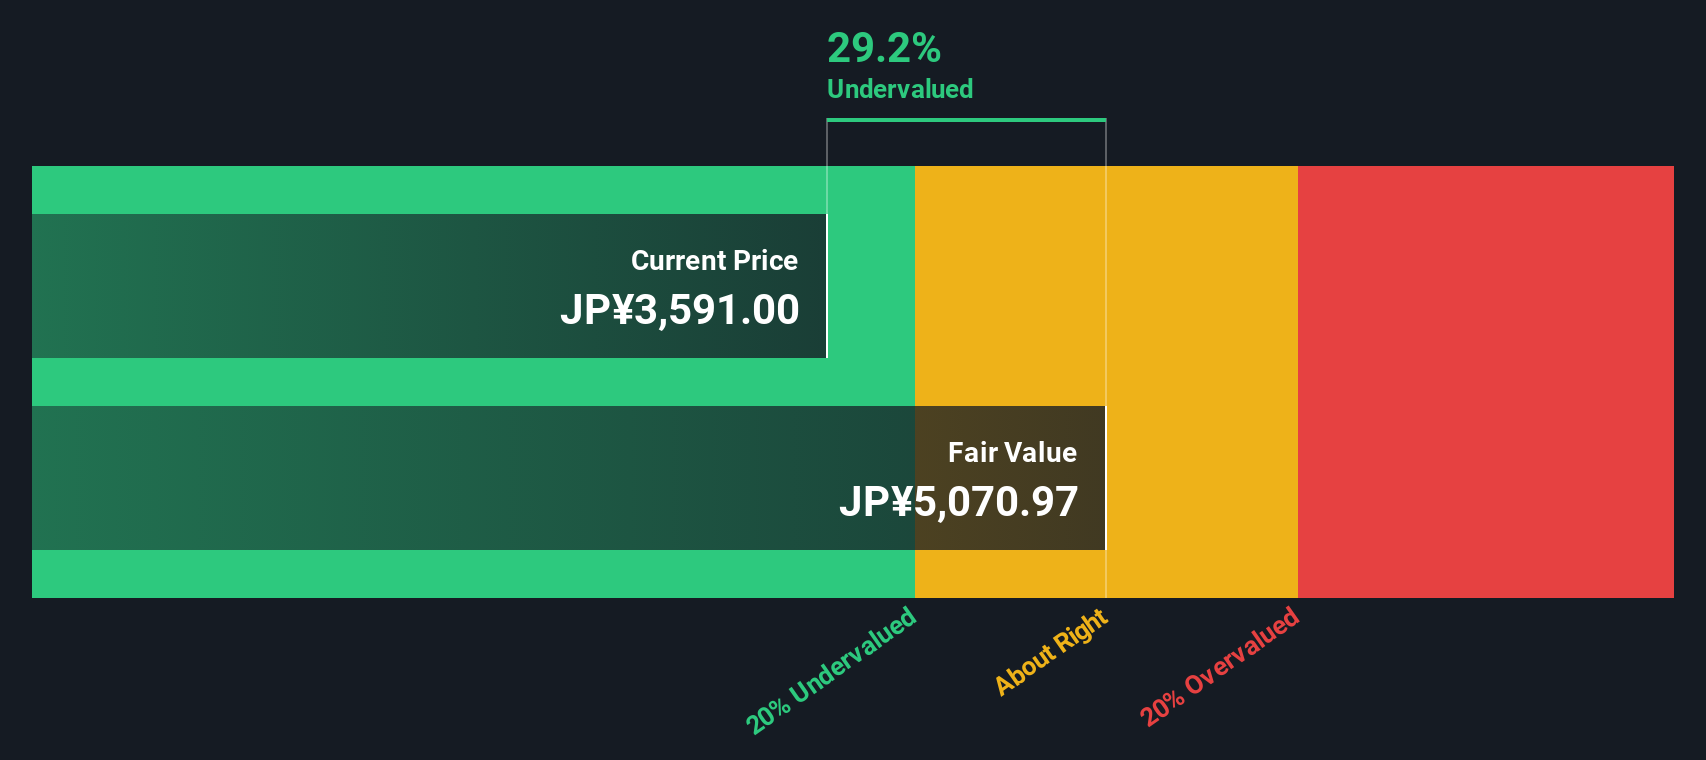
With shares still trading around 27% below intrinsic value estimates despite recent gains, investors are left wondering if Glory is a hidden value play ready for upside, or if the market has already accounted for the company’s growth prospects.
Advertisement
Price-to-Earnings of 19.4x: Is it justified?
Glory is currently trading at a price-to-earnings (P/E) ratio of 19.4x, which is well above both its industry and peer group averages. With the latest share price closing at ¥3,698, investors are paying a significant premium compared to similar machinery stocks.
The price-to-earnings ratio reflects how much investors are willing to pay today for a company's earnings. For industrial and machinery companies like Glory, it is a standard measure of valuation, showing whether the market is betting on stronger profit growth compared to peers.
Looking closer, Glory’s P/E of 19.4x is notably higher than the Japan Machinery industry average of 13.5x and the peer average of 14.4x. Compared to the estimated fair P/E ratio for the company, which is 17.9x, Glory still appears pricey. This suggests the stock would need to deliver robust earnings growth or improved profitability to justify its premium, or its valuation could eventually align more with industry norms if results fall short.
However, slowing revenue growth or a dip in net income could challenge the optimistic outlook and potentially put pressure on Glory’s elevated valuation.
Another View: Discounted Cash Flow Model Calls Undervaluation
While the stock appears overvalued when considering its price-to-earnings ratio, our DCF model presents a different perspective. According to this approach, Glory’s shares are trading 27% below fair value estimates. This prompts the question: are investors overlooking a potential bargain, or do risks remain?
Simply Wall St performs a discounted cash flow (DCF) on every stock in the world every day (check out Glory for example). We show the entire calculation in full. You can track the result in your watchlist or portfolio and be alerted when this changes, or use our stock screener to discover 831 undervalued stocks based on their cash flows. If you save a screener we even alert you when new companies match - so you never miss a potential opportunity.
Build Your Own Glory Narrative
If you’d rather draw your own conclusions or want to dig deeper into Glory’s numbers, you can craft your personal take in just a few minutes. Do it your way
Don’t let your research end here. Unlock new investing angles and spark your portfolio with handpicked opportunities from the Simply Wall Street Screener today.
Find the latest innovations in healthcare by tracking these 34 healthcare AI stocks delivering breakthroughs in medical technology and AI-driven diagnostics.
This article by Simply Wall St is general in nature. We provide commentary based on historical data
and analyst forecasts only using an unbiased methodology and our articles are not intended to be financial advice. It does not constitute a recommendation to buy or sell any stock, and does not take account of your objectives, or your
financial situation. We aim to bring you long-term focused analysis driven by fundamental data.
Note that our analysis may not factor in the latest price-sensitive company announcements or qualitative material.
Simply Wall St has no position in any stocks mentioned.
New: Manage All Your Stock Portfolios in One Place
We've created the ultimate portfolio companion for stock investors, and it's free.
• Connect an unlimited number of Portfolios and see your total in one currency • Be alerted to new Warning Signs or Risks via email or mobile • Track the Fair Value of your stocks