Advertisement
Trinity Industrial (TSE:6382) Profit Margin Outperformance Reinforces Earnings Quality Narrative

Simply Wall St
Reviewed by Simply Wall St
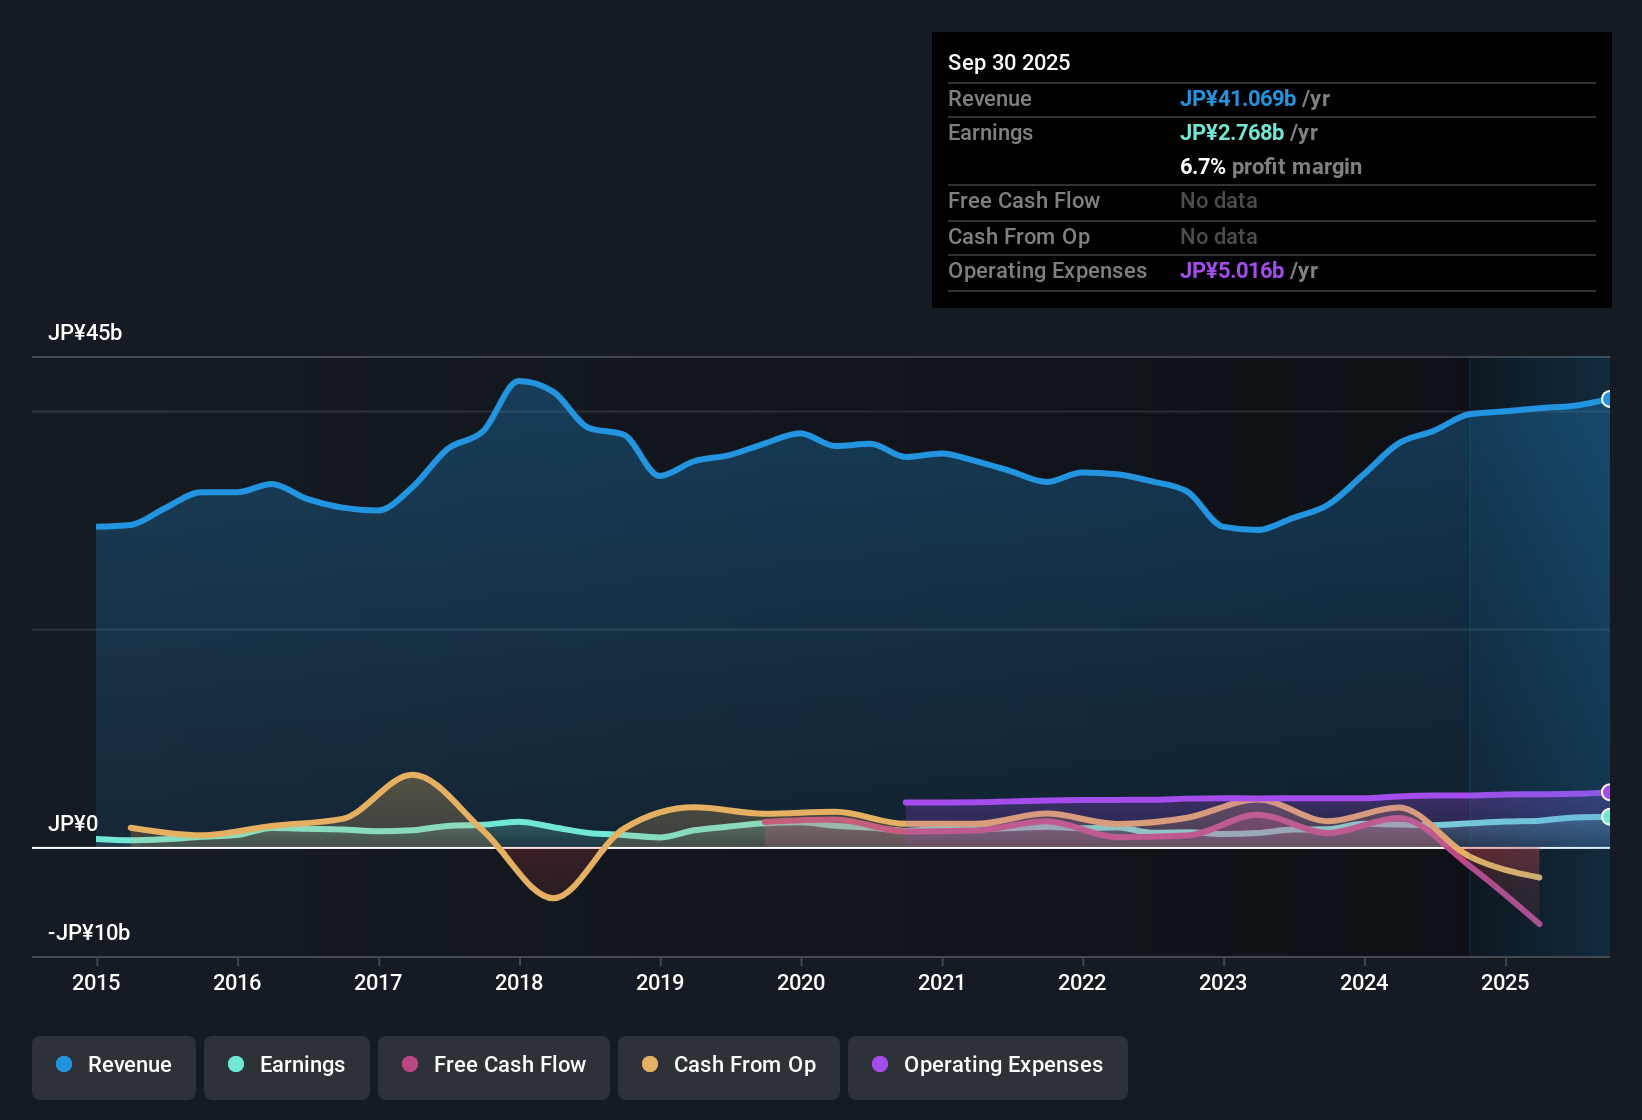
Trinity Industrial (TSE:6382) posted a net profit margin of 6.7%, up from 5.4% previously, while delivering 28.1% earnings growth over the last year, well ahead of its five-year average of 11.4% per year. At a price-to-earnings ratio of 6.9x, the company trades at a notable discount to both the Japanese machinery industry and peer averages, suggesting the stock’s valuation remains attractive. With consistently rising profits and strong historical growth trends, these results continue to showcase Trinity’s solid operating quality even as some investors remain watchful of its dividend sustainability.
See our full analysis for Trinity Industrial.The next section will put Trinity Industrial’s headline numbers up against the dominant narratives in the market, highlighting where perceptions are confirmed and where surprises might emerge.
Curious how numbers become stories that shape markets? Explore Community Narratives
Profit Margin Gain Sustains Quality Narrative
- Trinity Industrial’s profit margin reached 6.7%, up from 5.4% previously, underscoring a steady climb in operating quality beyond the headline profit percentage growth covered earlier.
- What stands out in the prevailing market view is how consecutive years of double-digit earnings expansion emphasize not just a statistical jump, but a foundation for durability going forward.
- This margin outperformance heavily supports claims that long-running operational strength is not a fluke but a characteristic of the business, especially given the five-year average growth of 11.4% per year.
- Despite broader industrial trends presenting challenges, the sustained margin improvement suggests resilience and sets the company apart from sector peers whose margins have faced more volatility.
Dividend Sustainability Remains Under Watch
- Risks flagged in the filing focus almost solely on the sustainability of the dividend, with no other major concerns raised.
- The prevailing market view highlights that while profit growth is robust, income-focused investors should stay alert.
- The strong net margin and high earnings quality create room for future dividend distributions. Yet, the company’s willingness or ability to maintain its dividend policy is still monitored closely in market discussions.
- This singular risk area creates a tension with the otherwise appealing growth story and serves as a reminder that even quality companies must regularly re-prove their income credentials.
Valuation Gap: Deep Discount to Industry Multiples
- With a price-to-earnings ratio of 6.9x, Trinity trades well below both the Japanese machinery industry average of 13.5x and peer average of 14.9x. This marks a substantial relative undervaluation that is distinct from just looking at the absolute share price movement.
- According to the prevailing market view, this deep discount signals that the market may be pricing in past strong performance more than future potential.
- The company’s DCF fair value is 744.98, compared to its current share price of 1,177.00, indicating shares trade at a premium to intrinsic value even though they remain discounted to sector averages.
- This positioning forces fundamental investors to weigh the risk that the valuation reflects a plateau rather than continued upside, despite Trinity's visible operating momentum.
See what the community is saying about Trinity Industrial
See what the community is saying about Trinity IndustrialNext Steps
Don't just look at this quarter; the real story is in the long-term trend. We've done an in-depth analysis on Trinity Industrial's growth and its valuation to see if today's price is a bargain. Add the company to your watchlist or portfolio now so you don't miss the next big move.
See What Else Is Out There
Despite Trinity Industrial’s attractive growth and margin improvements, uncertainty around dividend sustainability continues to cast doubt for income-focused investors seeking reliability.
If you want income potential without second-guessing payouts, check out these 1993 dividend stocks with yields > 3% which consistently reward shareholders with robust and dependable yields.
This article by Simply Wall St is general in nature. We provide commentary based on historical data and analyst forecasts only using an unbiased methodology and our articles are not intended to be financial advice. It does not constitute a recommendation to buy or sell any stock, and does not take account of your objectives, or your financial situation. We aim to bring you long-term focused analysis driven by fundamental data. Note that our analysis may not factor in the latest price-sensitive company announcements or qualitative material. Simply Wall St has no position in any stocks mentioned.
Valuation is complex, but we're here to simplify it.
Discover if Trinity Industrial might be undervalued or overvalued with our detailed analysis, featuring fair value estimates, potential risks, dividends, insider trades, and its financial condition.
Access Free AnalysisHave feedback on this article? Concerned about the content? Get in touch with us directly. Alternatively, email editorial-team@simplywallst.com
About TSE:6382
Trinity Industrial
Designs, manufactures, sells, and installs coating plants, machinery, and industrial equipment in Japan.
Flawless balance sheet with solid track record and pays a dividend.
Market Insights

Advertisement
Community Narratives
The company that turned a verb into a global necessity and basically runs the modern internet, digital ads, smartphones, maps, and AI.
Fair Value US$300.00|6.3% undervalued
OS
Community Contributor
Flowers Foods Pays A Fair Price For Health
Fair Value US$16.12|26.0% undervalued
NV
Community Contributor
TMX Group will thrive with 33.3% profit margin and enduring market moat
Fair Value CA$49.90|3.7% overvalued
LI
Community Contributor