Tsurumi ManufacturingLtd's (TSE:6351) 39% CAGR outpaced the company's earnings growth over the same three-year period


The worst result, after buying shares in a company (assuming no leverage), would be if you lose all the money you put in. But when you pick a company that is really flourishing, you can make more than 100%. To wit, the Tsurumi Manufacturing Co.,Ltd. (TSE:6351) share price has flown 156% in the last three years. How nice for those who held the stock! In more good news, the share price has risen 21% in thirty days.
The past week has proven to be lucrative for Tsurumi ManufacturingLtd investors, so let's see if fundamentals drove the company's three-year performance.
Check out our latest analysis for Tsurumi ManufacturingLtd
While the efficient markets hypothesis continues to be taught by some, it has been proven that markets are over-reactive dynamic systems, and investors are not always rational. One flawed but reasonable way to assess how sentiment around a company has changed is to compare the earnings per share (EPS) with the share price.
Tsurumi ManufacturingLtd was able to grow its EPS at 25% per year over three years, sending the share price higher. This EPS growth is lower than the 37% average annual increase in the share price. This suggests that, as the business progressed over the last few years, it gained the confidence of market participants. That's not necessarily surprising considering the three-year track record of earnings growth.
The graphic below depicts how EPS has changed over time (unveil the exact values by clicking on the image).
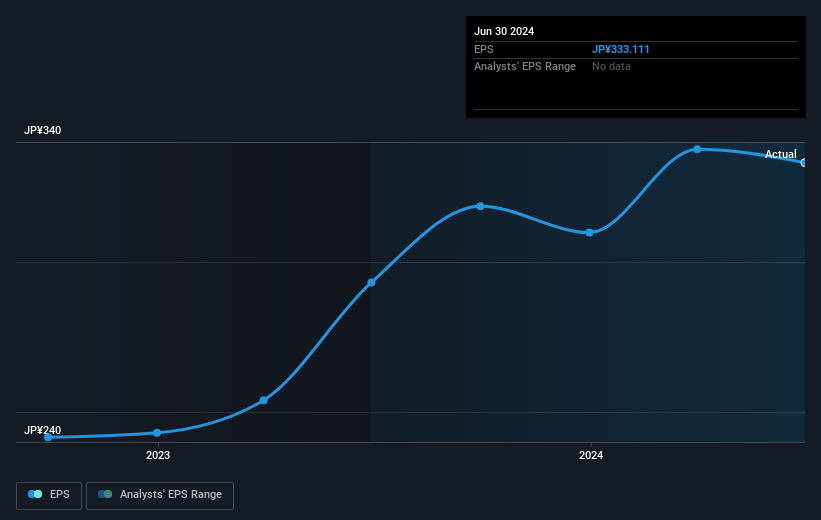
It might be well worthwhile taking a look at our free report on Tsurumi ManufacturingLtd's earnings, revenue and cash flow.
What About Dividends?
It is important to consider the total shareholder return, as well as the share price return, for any given stock. Whereas the share price return only reflects the change in the share price, the TSR includes the value of dividends (assuming they were reinvested) and the benefit of any discounted capital raising or spin-off. It's fair to say that the TSR gives a more complete picture for stocks that pay a dividend. In the case of Tsurumi ManufacturingLtd, it has a TSR of 170% for the last 3 years. That exceeds its share price return that we previously mentioned. The dividends paid by the company have thusly boosted the total shareholder return.
A Different Perspective
We're pleased to report that Tsurumi ManufacturingLtd shareholders have received a total shareholder return of 46% over one year. And that does include the dividend. That's better than the annualised return of 19% over half a decade, implying that the company is doing better recently. In the best case scenario, this may hint at some real business momentum, implying that now could be a great time to delve deeper. Is Tsurumi ManufacturingLtd cheap compared to other companies? These 3 valuation measures might help you decide.
We will like Tsurumi ManufacturingLtd better if we see some big insider buys. While we wait, check out this free list of undervalued stocks (mostly small caps) with considerable, recent, insider buying.
Please note, the market returns quoted in this article reflect the market weighted average returns of stocks that currently trade on Japanese exchanges.
Valuation is complex, but we're here to simplify it.
Discover if Tsurumi ManufacturingLtd might be undervalued or overvalued with our detailed analysis, featuring fair value estimates, potential risks, dividends, insider trades, and its financial condition.
Access Free AnalysisHave feedback on this article? Concerned about the content? Get in touch with us directly. Alternatively, email editorial-team (at) simplywallst.com.
This article by Simply Wall St is general in nature. We provide commentary based on historical data and analyst forecasts only using an unbiased methodology and our articles are not intended to be financial advice. It does not constitute a recommendation to buy or sell any stock, and does not take account of your objectives, or your financial situation. We aim to bring you long-term focused analysis driven by fundamental data. Note that our analysis may not factor in the latest price-sensitive company announcements or qualitative material. Simply Wall St has no position in any stocks mentioned.
About TSE:6351
Tsurumi ManufacturingLtd
Produces, purchases, imports, exports, sells, and leases submersible pumps and peripheral equipment worldwide.
Excellent balance sheet with proven track record and pays a dividend.

