Advertisement
Okuma (TSE:6103): Examining Valuation as Shares Reflect Shifting Investor Sentiment

Simply Wall St
Reviewed by Simply Wall St
Okuma (TSE:6103) shares have caught the attention of investors recently, despite the absence of a specific news event driving the move. The stock’s performance may reflect ongoing shifts in the broader capital goods sector as well as investor sentiment toward manufacturing stocks in Japan.
See our latest analysis for Okuma.
Okuma’s recent share price movement hints at shifting investor appetite, with some short-term volatility. However, the company has achieved a respectable 4.7% total shareholder return over the past year and an impressive 49.7% over the last three years. This suggests the longer-term momentum is still very much alive.
If you’re eager to see where the next growth stories might come from, now is a great moment to broaden your search and discover fast growing stocks with high insider ownership
Yet with shares trading below analyst price targets and robust recent earnings growth, investors now face the classic question: is Okuma undervalued, or is the market already factoring in all the potential upside?
Price-to-Earnings of 24.2x: Is it justified?
Okuma is currently trading at a price-to-earnings (P/E) ratio of 24.2x, a level significantly higher than its industry peers and historical norms. At its last close of ¥3,420, this multiple suggests that investors are paying a much higher price per yen of earnings compared to the average in the Japanese machinery sector.
The P/E ratio measures how much investors are willing to spend for each unit of net profit the company generates. For capital goods and manufacturing companies like Okuma, this metric often reflects market confidence in consistent earnings growth and future profitability. However, a very high P/E could also signal over-optimism or a disconnect from actual business fundamentals.
Currently, Okuma’s P/E is well above both the peer average of 14.9x and the broader JP Machinery industry average of 13.2x. Even relative to the estimated Fair Price-to-Earnings Ratio of 21.5x, Okuma appears expensive. This elevated valuation suggests strong positive sentiment, but also raises questions about how much future growth is already priced in by the market.
Explore the SWS fair ratio for Okuma
Result: Price-to-Earnings of 24.2x (OVERVALUED)
However, weaker future earnings or a slowdown in sector-wide demand could challenge the optimistic view currently reflected in Okuma’s valuation.
Find out about the key risks to this Okuma narrative.
Another View: Discounted Cash Flow Model Paints a Different Picture
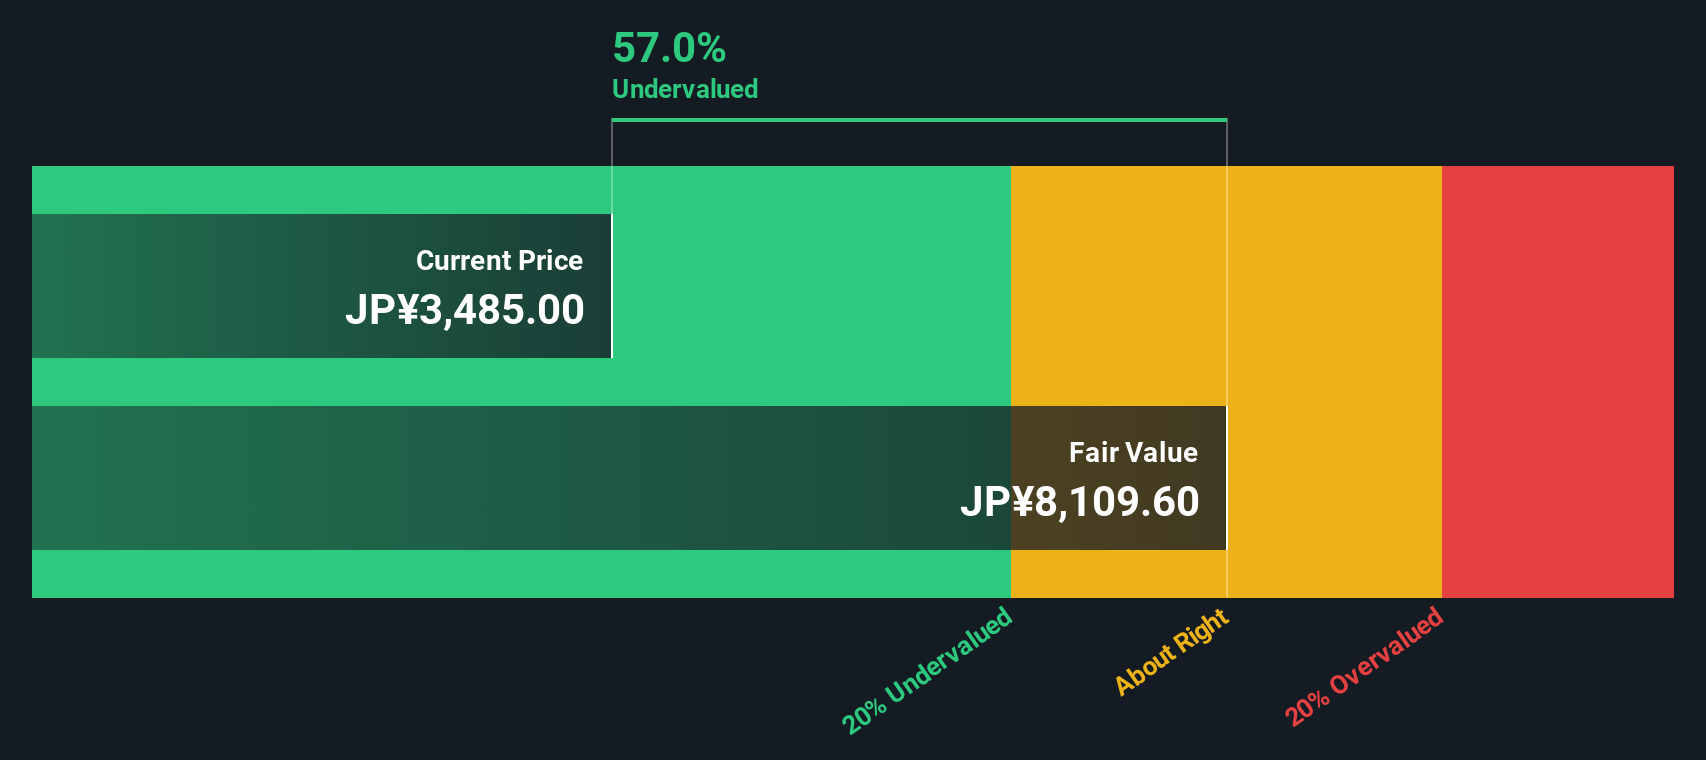
While Okuma’s current valuation looks high compared to peers and industry based on its P/E ratio, the SWS DCF model tells a contrasting story. According to our DCF analysis, Okuma trades at a substantial 56.8% discount to its estimated fair value. Could the market be missing something?
Look into how the SWS DCF model arrives at its fair value.
Simply Wall St performs a discounted cash flow (DCF) on every stock in the world every day (check out Okuma for example). We show the entire calculation in full. You can track the result in your watchlist or portfolio and be alerted when this changes, or use our stock screener to discover 848 undervalued stocks based on their cash flows. If you save a screener we even alert you when new companies match - so you never miss a potential opportunity.
Build Your Own Okuma Narrative
If you like to reach your own conclusions or question the story so far, why not explore the numbers and assemble your view in just a few minutes: Do it your way
A great starting point for your Okuma research is our analysis highlighting 2 key rewards and 2 important warning signs that could impact your investment decision.
Looking for more investment ideas?
Don’t let the next big opportunity pass you by. Use the Simply Wall Street Screener and take control of your investment journey with these powerful tools:
- Capture high potential with these 848 undervalued stocks based on cash flows, which are trading below their intrinsic value and could offer significant upside as the market catches on.
- Unlock the future of medicine by searching these 32 healthcare AI stocks, where artificial intelligence is being blended with healthcare innovation for breakthrough results.
- Target reliable income streams by reviewing these 17 dividend stocks with yields > 3%, offering attractive yields above 3 percent for steady portfolio growth.
This article by Simply Wall St is general in nature. We provide commentary based on historical data and analyst forecasts only using an unbiased methodology and our articles are not intended to be financial advice. It does not constitute a recommendation to buy or sell any stock, and does not take account of your objectives, or your financial situation. We aim to bring you long-term focused analysis driven by fundamental data. Note that our analysis may not factor in the latest price-sensitive company announcements or qualitative material. Simply Wall St has no position in any stocks mentioned.
New: AI Stock Screener & Alerts
Our new AI Stock Screener scans the market every day to uncover opportunities.
• Dividend Powerhouses (3%+ Yield)
• Undervalued Small Caps with Insider Buying
• High growth Tech and AI Companies
Or build your own from over 50 metrics.
Have feedback on this article? Concerned about the content? Get in touch with us directly. Alternatively, email editorial-team@simplywallst.com
About TSE:6103
Okuma
Manufactures and sells machine tools in Japan, the United States, Europe, and Asia/Pacific.
Excellent balance sheet with reasonable growth potential.
Similar Companies
Market Insights

Advertisement
Community Narratives
The company that turned a verb into a global necessity and basically runs the modern internet, digital ads, smartphones, maps, and AI.
Fair Value US$300.00|5.1% undervalued
OS
Community Contributor
Flowers Foods Pays A Fair Price For Health
Fair Value US$16.12|27.7% undervalued
NV
Community Contributor
TMX Group will thrive with 33.3% profit margin and enduring market moat
Fair Value CA$49.90|0.2% overvalued
LI
Community Contributor
The "Molecular Pencil": Why Beam's Technology is Built to Win
Fair Value US$65.01|64.4% undervalued
DA
Community Contributor