
Advertisement
Some say volatility, rather than debt, is the best way to think about risk as an investor, but Warren Buffett famously said that 'Volatility is far from synonymous with risk.' It's only natural to consider a company's balance sheet when you examine how risky it is, since debt is often involved when a business collapses. We note that Nisshinbo Holdings Inc. (TSE:3105) does have debt on its balance sheet. But should shareholders be worried about its use of debt?
When Is Debt A Problem?
Debt assists a business until the business has trouble paying it off, either with new capital or with free cash flow. In the worst case scenario, a company can go bankrupt if it cannot pay its creditors. However, a more common (but still painful) scenario is that it has to raise new equity capital at a low price, thus permanently diluting shareholders. Having said that, the most common situation is where a company manages its debt reasonably well - and to its own advantage. The first thing to do when considering how much debt a business uses is to look at its cash and debt together.
How Much Debt Does Nisshinbo Holdings Carry?
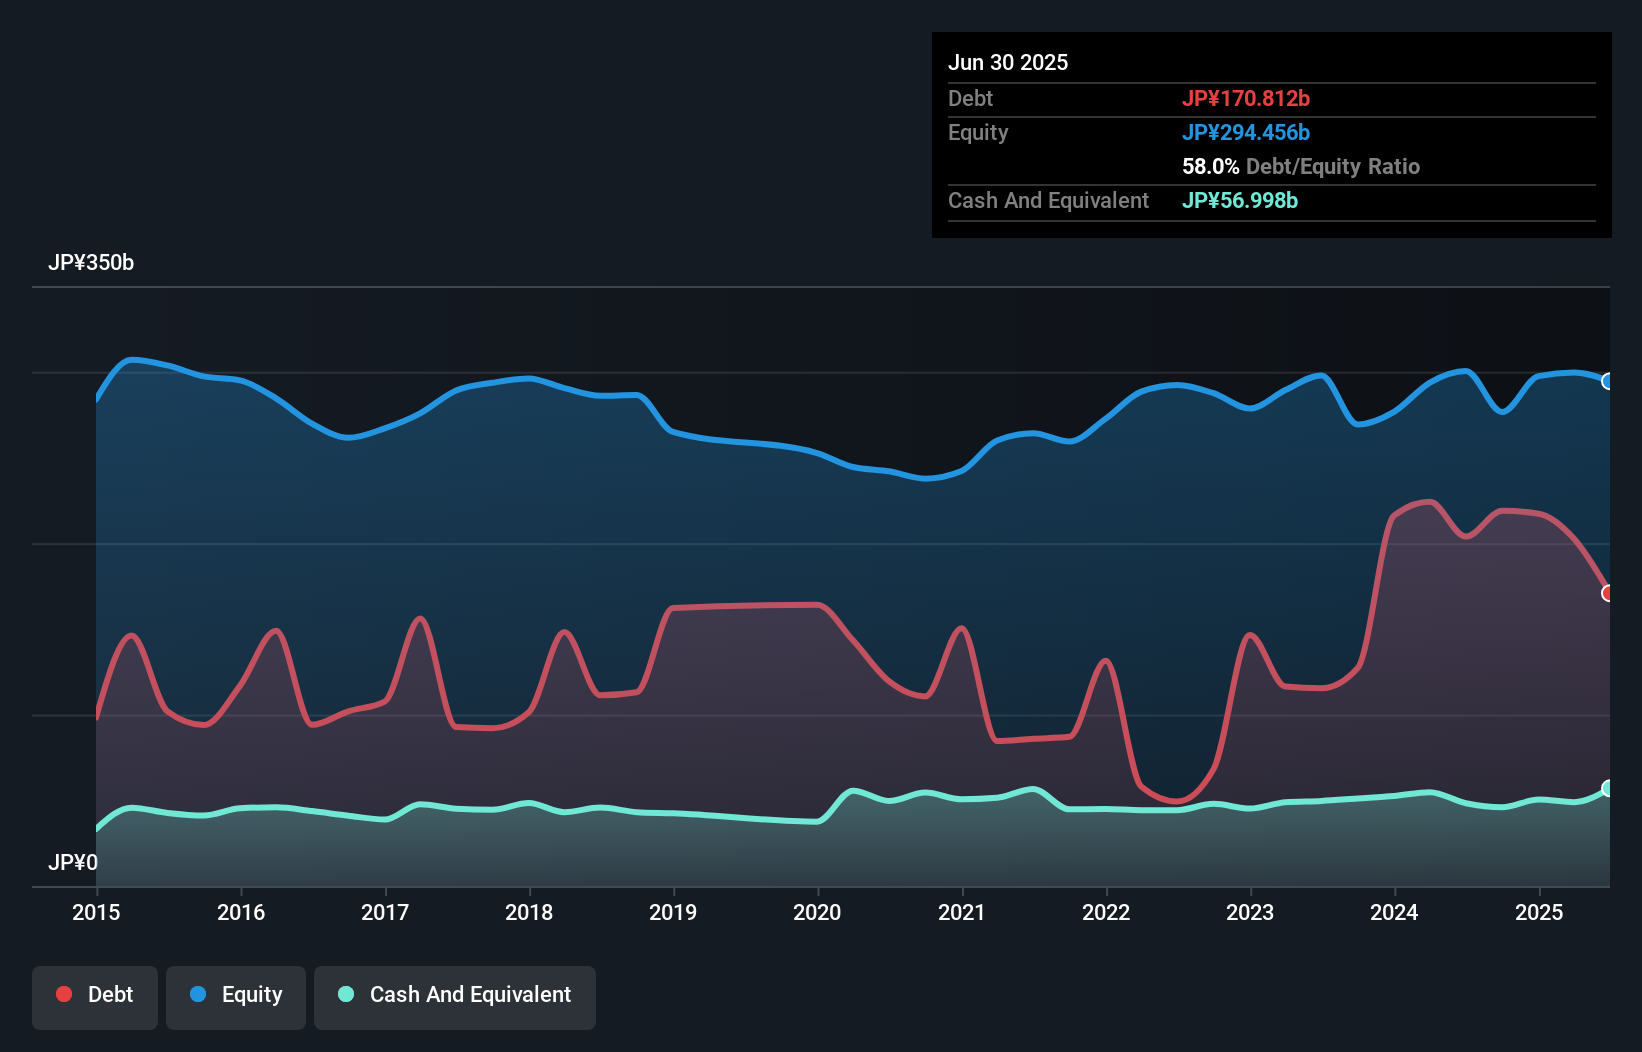
As you can see below, Nisshinbo Holdings had JP¥170.8b of debt at June 2025, down from JP¥203.8b a year prior. However, because it has a cash reserve of JP¥57.0b, its net debt is less, at about JP¥113.8b.
How Healthy Is Nisshinbo Holdings' Balance Sheet?
According to the last reported balance sheet, Nisshinbo Holdings had liabilities of JP¥154.3b due within 12 months, and liabilities of JP¥173.1b due beyond 12 months. On the other hand, it had cash of JP¥57.0b and JP¥116.3b worth of receivables due within a year. So its liabilities outweigh the sum of its cash and (near-term) receivables by JP¥154.1b.
This is a mountain of leverage relative to its market capitalization of JP¥189.1b. Should its lenders demand that it shore up the balance sheet, shareholders would likely face severe dilution.
View our latest analysis for Nisshinbo Holdings
We use two main ratios to inform us about debt levels relative to earnings. The first is net debt divided by earnings before interest, tax, depreciation, and amortization (EBITDA), while the second is how many times its earnings before interest and tax (EBIT) covers its interest expense (or its interest cover, for short). The advantage of this approach is that we take into account both the absolute quantum of debt (with net debt to EBITDA) and the actual interest expenses associated with that debt (with its interest cover ratio).
Nisshinbo Holdings's net debt to EBITDA ratio of about 2.1 suggests only moderate use of debt. And its commanding EBIT of 74.4 times its interest expense, implies the debt load is as light as a peacock feather. Notably, Nisshinbo Holdings's EBIT launched higher than Elon Musk, gaining a whopping 294% on last year. When analysing debt levels, the balance sheet is the obvious place to start. But ultimately the future profitability of the business will decide if Nisshinbo Holdings can strengthen its balance sheet over time. So if you want to see what the professionals think, you might find this free report on analyst profit forecasts to be interesting.
Finally, while the tax-man may adore accounting profits, lenders only accept cold hard cash. So we always check how much of that EBIT is translated into free cash flow. Over the most recent three years, Nisshinbo Holdings recorded free cash flow worth 76% of its EBIT, which is around normal, given free cash flow excludes interest and tax. This free cash flow puts the company in a good position to pay down debt, when appropriate.
Our View
Nisshinbo Holdings's interest cover suggests it can handle its debt as easily as Cristiano Ronaldo could score a goal against an under 14's goalkeeper. But, on a more sombre note, we are a little concerned by its level of total liabilities. When we consider the range of factors above, it looks like Nisshinbo Holdings is pretty sensible with its use of debt. That means they are taking on a bit more risk, in the hope of boosting shareholder returns. Over time, share prices tend to follow earnings per share, so if you're interested in Nisshinbo Holdings, you may well want to click here to check an interactive graph of its earnings per share history.
If, after all that, you're more interested in a fast growing company with a rock-solid balance sheet, then check out our list of net cash growth stocks without delay.
Valuation is complex, but we're here to simplify it.
Discover if Nisshinbo Holdings might be undervalued or overvalued with our detailed analysis, featuring fair value estimates, potential risks, dividends, insider trades, and its financial condition.
Access Free AnalysisHave feedback on this article? Concerned about the content? Get in touch with us directly. Alternatively, email editorial-team (at) simplywallst.com.
This article by Simply Wall St is general in nature. We provide commentary based on historical data and analyst forecasts only using an unbiased methodology and our articles are not intended to be financial advice. It does not constitute a recommendation to buy or sell any stock, and does not take account of your objectives, or your financial situation. We aim to bring you long-term focused analysis driven by fundamental data. Note that our analysis may not factor in the latest price-sensitive company announcements or qualitative material. Simply Wall St has no position in any stocks mentioned.
About TSE:3105
Nisshinbo Holdings
Operates wireless communication, microdevice, automobile brakes, precision instruments, chemicals, textiles, and real estate businesses in China and internationally.
Excellent balance sheet established dividend payer.
Market Insights

Advertisement
Community Narratives
The company that turned a verb into a global necessity and basically runs the modern internet, digital ads, smartphones, maps, and AI.
Fair Value US$300.00|6.3% undervalued
OS
Community Contributor
Flowers Foods Pays A Fair Price For Health
Fair Value US$16.12|26.0% undervalued
NV
Community Contributor
TMX Group will thrive with 33.3% profit margin and enduring market moat
Fair Value CA$49.90|3.7% overvalued
LI
Community Contributor