Advertisement
Juroku Financial Group (TSE:7380): Evaluating Valuation After Upgraded Dividend Forecast and Strong Financial Results

Simply Wall St
Reviewed by Simply Wall St
Juroku Financial Group Inc (TSE:7380) just announced an increase in its interim dividend forecast to ¥100 per share for the fiscal year ending March 2026, highlighting its steady financial performance and focus on rewarding shareholders.
See our latest analysis for Juroku Financial GroupInc.
Juroku Financial GroupInc has notched up a 30.8% share price return year-to-date, with investor confidence clearly on the rise after the latest dividend forecast boost. Looking further back, its total shareholder return of 41.4% over the last year and an impressive 249% over the past five years show both steady momentum and robust long-term value creation.
If consistent shareholder returns matter to you, now is a great time to expand your search and discover fast growing stocks with high insider ownership
With shares surging and dividends rising, investors are left to wonder whether Juroku Financial Group is still undervalued and poised for further gains, or if the market has already priced in future growth potential.
Price-to-Earnings of 9.7x: Is it justified?
Juroku Financial GroupInc is currently trading at a price-to-earnings ratio of 9.7x, which is below both its peer and industry averages. The last closing price of ¥5,590 suggests the market may be undervaluing the company's recent earnings relative to the sector.
The price-to-earnings (P/E) ratio is a key measure that reflects how much investors are willing to pay for each unit of earnings. In banking, a lower P/E can sometimes imply caution or skepticism about future earnings growth. It may also highlight an opportunity when compared to similar companies.
At 9.7x, Juroku Financial GroupInc stands out as offering better value compared to the JP Banks industry average of 11.5x and the peer average of 14.9x. This could indicate the market is not fully pricing in the company’s profit potential, especially given its solid track record of 7% compound annual earnings growth over five years.
See what the numbers say about this price — find out in our valuation breakdown.
Result: Price-to-Earnings of 9.7x (UNDERVALUED)
However, uncertain revenue and profit trends or an unexpected shift in market confidence could quickly change the outlook for Juroku Financial Group Inc.
Find out about the key risks to this Juroku Financial GroupInc narrative.
Another View: SWS DCF Model Suggests a Different Story
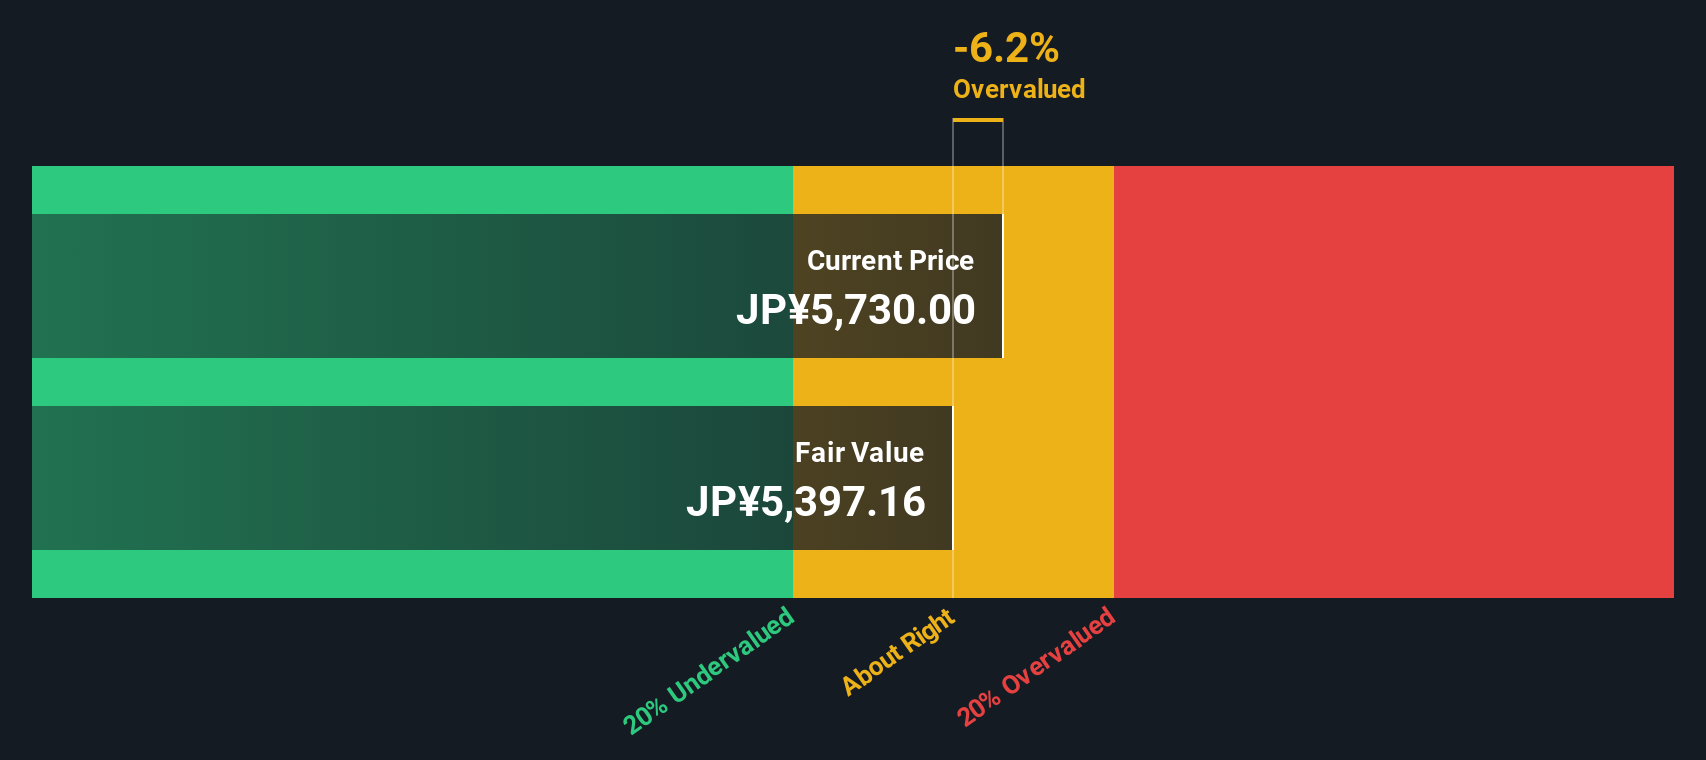
While the price-to-earnings ratio paints Juroku Financial GroupInc as undervalued, our SWS DCF model takes a more cautious stance. At ¥5,590, the shares are trading above our estimate of fair value at ¥5,278, which points to slight overvaluation. Could the market be factoring in too much optimism?
Look into how the SWS DCF model arrives at its fair value.
Simply Wall St performs a discounted cash flow (DCF) on every stock in the world every day (check out Juroku Financial GroupInc for example). We show the entire calculation in full. You can track the result in your watchlist or portfolio and be alerted when this changes, or use our stock screener to discover 831 undervalued stocks based on their cash flows. If you save a screener we even alert you when new companies match - so you never miss a potential opportunity.
Build Your Own Juroku Financial GroupInc Narrative
If you want to dig into the numbers yourself or take a different perspective, it only takes a few minutes to build your own view. So why not Do it your way
A great starting point for your Juroku Financial GroupInc research is our analysis highlighting 2 key rewards and 2 important warning signs that could impact your investment decision.
Looking for more investment ideas?
Don't sit on the sidelines while others uncover fresh opportunities. These hand-picked stock themes could easily give your portfolio the edge it needs this year.
- Capture serious growth potential by checking out these 831 undervalued stocks based on cash flows that the market may be overlooking right now.
- Tap into the future of medicine and innovation with these 34 healthcare AI stocks reshaping how we diagnose and treat diseases.
- Unlock streams of passive income with these 24 dividend stocks with yields > 3% boasting robust yields and reliable payout histories.
This article by Simply Wall St is general in nature. We provide commentary based on historical data and analyst forecasts only using an unbiased methodology and our articles are not intended to be financial advice. It does not constitute a recommendation to buy or sell any stock, and does not take account of your objectives, or your financial situation. We aim to bring you long-term focused analysis driven by fundamental data. Note that our analysis may not factor in the latest price-sensitive company announcements or qualitative material. Simply Wall St has no position in any stocks mentioned.
New: Manage All Your Stock Portfolios in One Place
We've created the ultimate portfolio companion for stock investors, and it's free.
• Connect an unlimited number of Portfolios and see your total in one currency
• Be alerted to new Warning Signs or Risks via email or mobile
• Track the Fair Value of your stocks
Have feedback on this article? Concerned about the content? Get in touch with us directly. Alternatively, email editorial-team@simplywallst.com
About TSE:7380
Juroku Financial GroupInc
Provides banking and leasing products and services in Japan.
Excellent balance sheet second-rate dividend payer.
Market Insights

Advertisement
Community Narratives
The company that turned a verb into a global necessity and basically runs the modern internet, digital ads, smartphones, maps, and AI.
Fair Value US$300.00|6.2% undervalued
OS
Community Contributor
Flowers Foods Pays A Fair Price For Health
Fair Value US$16.12|25.1% undervalued
NV
Community Contributor
TMX Group will thrive with 33.3% profit margin and enduring market moat
Fair Value CA$49.90|0.04% overvalued
LI
Community Contributor