
Advertisement
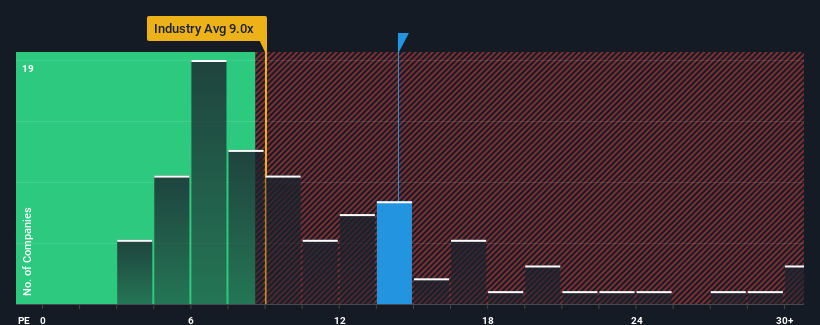
With a median price-to-earnings (or "P/E") ratio of close to 14x in Japan, you could be forgiven for feeling indifferent about Nifco Inc.'s (TSE:7988) P/E ratio of 14.4x. While this might not raise any eyebrows, if the P/E ratio is not justified investors could be missing out on a potential opportunity or ignoring looming disappointment.
Nifco could be doing better as it's been growing earnings less than most other companies lately. It might be that many expect the uninspiring earnings performance to strengthen positively, which has kept the P/E from falling. You'd really hope so, otherwise you're paying a relatively elevated price for a company with this sort of growth profile.
View our latest analysis for Nifco
What Are Growth Metrics Telling Us About The P/E?
Nifco's P/E ratio would be typical for a company that's only expected to deliver moderate growth, and importantly, perform in line with the market.
Taking a look back first, we see that the company managed to grow earnings per share by a handy 5.0% last year. This was backed up an excellent period prior to see EPS up by 103% in total over the last three years. Therefore, it's fair to say the earnings growth recently has been superb for the company.
Looking ahead now, EPS is anticipated to climb by 14% per year during the coming three years according to the nine analysts following the company. With the market only predicted to deliver 11% per year, the company is positioned for a stronger earnings result.
With this information, we find it interesting that Nifco is trading at a fairly similar P/E to the market. Apparently some shareholders are skeptical of the forecasts and have been accepting lower selling prices.
What We Can Learn From Nifco's P/E?
It's argued the price-to-earnings ratio is an inferior measure of value within certain industries, but it can be a powerful business sentiment indicator.
We've established that Nifco currently trades on a lower than expected P/E since its forecast growth is higher than the wider market. There could be some unobserved threats to earnings preventing the P/E ratio from matching the positive outlook. At least the risk of a price drop looks to be subdued, but investors seem to think future earnings could see some volatility.
It's always necessary to consider the ever-present spectre of investment risk. We've identified 1 warning sign with Nifco, and understanding should be part of your investment process.
If you're unsure about the strength of Nifco's business, why not explore our interactive list of stocks with solid business fundamentals for some other companies you may have missed.
Valuation is complex, but we're here to simplify it.
Discover if Nifco might be undervalued or overvalued with our detailed analysis, featuring fair value estimates, potential risks, dividends, insider trades, and its financial condition.
Access Free AnalysisHave feedback on this article? Concerned about the content? Get in touch with us directly. Alternatively, email editorial-team (at) simplywallst.com.
This article by Simply Wall St is general in nature. We provide commentary based on historical data and analyst forecasts only using an unbiased methodology and our articles are not intended to be financial advice. It does not constitute a recommendation to buy or sell any stock, and does not take account of your objectives, or your financial situation. We aim to bring you long-term focused analysis driven by fundamental data. Note that our analysis may not factor in the latest price-sensitive company announcements or qualitative material. Simply Wall St has no position in any stocks mentioned.
About TSE:7988
Nifco
Manufactures and sells industrial plastic parts and components in Japan, Asia, North America, China, South Korea, the United States, and Europe.
Flawless balance sheet with solid track record.
Similar Companies
Market Insights

Advertisement
Community Narratives
MicroVision will explode future revenue by 380.37% with a vision towards success
Fair Value US$60.00|98.4% undervalued
TH
Community Contributor
The Indispensable Artery for a New North American Economy
Fair Value CA$132.87|1.3% undervalued
TI
Community Contributor