
Advertisement
Howard Marks put it nicely when he said that, rather than worrying about share price volatility, 'The possibility of permanent loss is the risk I worry about... and every practical investor I know worries about.' It's only natural to consider a company's balance sheet when you examine how risky it is, since debt is often involved when a business collapses. We can see that Nifco Inc. (TSE:7988) does use debt in its business. But is this debt a concern to shareholders?
Why Does Debt Bring Risk?
Debt is a tool to help businesses grow, but if a business is incapable of paying off its lenders, then it exists at their mercy. If things get really bad, the lenders can take control of the business. However, a more frequent (but still costly) occurrence is where a company must issue shares at bargain-basement prices, permanently diluting shareholders, just to shore up its balance sheet. Of course, the upside of debt is that it often represents cheap capital, especially when it replaces dilution in a company with the ability to reinvest at high rates of return. The first thing to do when considering how much debt a business uses is to look at its cash and debt together.
View our latest analysis for Nifco
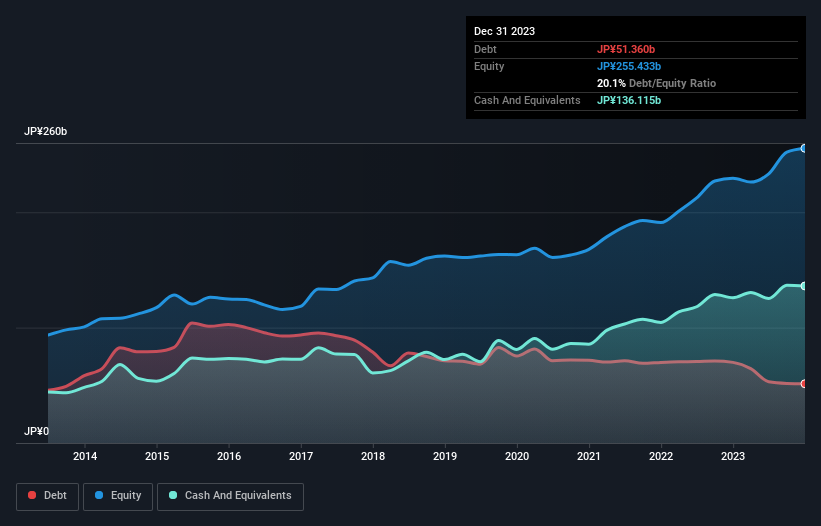
What Is Nifco's Net Debt?
As you can see below, Nifco had JP¥51.4b of debt at December 2023, down from JP¥69.9b a year prior. However, its balance sheet shows it holds JP¥136.1b in cash, so it actually has JP¥84.8b net cash.
How Strong Is Nifco's Balance Sheet?
The latest balance sheet data shows that Nifco had liabilities of JP¥65.9b due within a year, and liabilities of JP¥58.7b falling due after that. Offsetting this, it had JP¥136.1b in cash and JP¥70.8b in receivables that were due within 12 months. So it actually has JP¥82.3b more liquid assets than total liabilities.
This surplus suggests that Nifco is using debt in a way that is appears to be both safe and conservative. Due to its strong net asset position, it is not likely to face issues with its lenders. Simply put, the fact that Nifco has more cash than debt is arguably a good indication that it can manage its debt safely.
Also positive, Nifco grew its EBIT by 22% in the last year, and that should make it easier to pay down debt, going forward. The balance sheet is clearly the area to focus on when you are analysing debt. But it is future earnings, more than anything, that will determine Nifco's ability to maintain a healthy balance sheet going forward. So if you're focused on the future you can check out this free report showing analyst profit forecasts.
But our final consideration is also important, because a company cannot pay debt with paper profits; it needs cold hard cash. Nifco may have net cash on the balance sheet, but it is still interesting to look at how well the business converts its earnings before interest and tax (EBIT) to free cash flow, because that will influence both its need for, and its capacity to manage debt. During the last three years, Nifco produced sturdy free cash flow equating to 78% of its EBIT, about what we'd expect. This cold hard cash means it can reduce its debt when it wants to.
Summing Up
While we empathize with investors who find debt concerning, you should keep in mind that Nifco has net cash of JP¥84.8b, as well as more liquid assets than liabilities. The cherry on top was that in converted 78% of that EBIT to free cash flow, bringing in JP¥34b. So is Nifco's debt a risk? It doesn't seem so to us. The balance sheet is clearly the area to focus on when you are analysing debt. However, not all investment risk resides within the balance sheet - far from it. For example, we've discovered 1 warning sign for Nifco that you should be aware of before investing here.
If, after all that, you're more interested in a fast growing company with a rock-solid balance sheet, then check out our list of net cash growth stocks without delay.
Valuation is complex, but we're here to simplify it.
Discover if Nifco might be undervalued or overvalued with our detailed analysis, featuring fair value estimates, potential risks, dividends, insider trades, and its financial condition.
Access Free AnalysisHave feedback on this article? Concerned about the content? Get in touch with us directly. Alternatively, email editorial-team (at) simplywallst.com.
This article by Simply Wall St is general in nature. We provide commentary based on historical data and analyst forecasts only using an unbiased methodology and our articles are not intended to be financial advice. It does not constitute a recommendation to buy or sell any stock, and does not take account of your objectives, or your financial situation. We aim to bring you long-term focused analysis driven by fundamental data. Note that our analysis may not factor in the latest price-sensitive company announcements or qualitative material. Simply Wall St has no position in any stocks mentioned.
About TSE:7988
Nifco
Manufactures and sells industrial plastic parts and components in Japan, Asia, North America, China, South Korea, the United States, and Europe.
Flawless balance sheet with solid track record.
Similar Companies
Market Insights

Advertisement
Community Narratives
MicroVision will explode future revenue by 380.37% with a vision towards success
Fair Value US$60.00|98.4% undervalued
TH
Community Contributor
The Indispensable Artery for a New North American Economy
Fair Value CA$132.87|1.3% undervalued
TI
Community Contributor