
Advertisement
Finding a business that has the potential to grow substantially is not easy, but it is possible if we look at a few key financial metrics. Ideally, a business will show two trends; firstly a growing return on capital employed (ROCE) and secondly, an increasing amount of capital employed. Put simply, these types of businesses are compounding machines, meaning they are continually reinvesting their earnings at ever-higher rates of return. Having said that, from a first glance at Mitsuba (TSE:7280) we aren't jumping out of our chairs at how returns are trending, but let's have a deeper look.
What Is Return On Capital Employed (ROCE)?
For those who don't know, ROCE is a measure of a company's yearly pre-tax profit (its return), relative to the capital employed in the business. The formula for this calculation on Mitsuba is:
Return on Capital Employed = Earnings Before Interest and Tax (EBIT) ÷ (Total Assets - Current Liabilities)
0.09 = JP¥18b ÷ (JP¥339b - JP¥144b) (Based on the trailing twelve months to December 2023).
So, Mitsuba has an ROCE of 9.0%. On its own that's a low return, but compared to the average of 7.1% generated by the Auto Components industry, it's much better.
See our latest analysis for Mitsuba
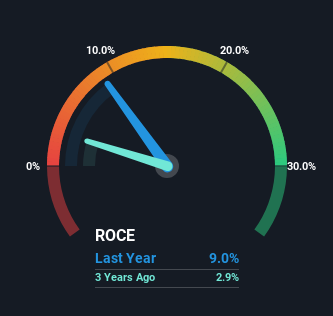
Historical performance is a great place to start when researching a stock so above you can see the gauge for Mitsuba's ROCE against it's prior returns. If you're interested in investigating Mitsuba's past further, check out this free graph covering Mitsuba's past earnings, revenue and cash flow.
How Are Returns Trending?
Things have been pretty stable at Mitsuba, with its capital employed and returns on that capital staying somewhat the same for the last five years. It's not uncommon to see this when looking at a mature and stable business that isn't re-investing its earnings because it has likely passed that phase of the business cycle. So unless we see a substantial change at Mitsuba in terms of ROCE and additional investments being made, we wouldn't hold our breath on it being a multi-bagger.
Another thing to note, Mitsuba has a high ratio of current liabilities to total assets of 42%. This can bring about some risks because the company is basically operating with a rather large reliance on its suppliers or other sorts of short-term creditors. While it's not necessarily a bad thing, it can be beneficial if this ratio is lower.
The Bottom Line
We can conclude that in regards to Mitsuba's returns on capital employed and the trends, there isn't much change to report on. Investors must think there's better things to come because the stock has knocked it out of the park, delivering a 145% gain to shareholders who have held over the last five years. But if the trajectory of these underlying trends continue, we think the likelihood of it being a multi-bagger from here isn't high.
On a final note, we found 2 warning signs for Mitsuba (1 is a bit concerning) you should be aware of.
For those who like to invest in solid companies, check out this free list of companies with solid balance sheets and high returns on equity.
New: Manage All Your Stock Portfolios in One Place
We've created the ultimate portfolio companion for stock investors, and it's free.
• Connect an unlimited number of Portfolios and see your total in one currency
• Be alerted to new Warning Signs or Risks via email or mobile
• Track the Fair Value of your stocks
Have feedback on this article? Concerned about the content? Get in touch with us directly. Alternatively, email editorial-team (at) simplywallst.com.
This article by Simply Wall St is general in nature. We provide commentary based on historical data and analyst forecasts only using an unbiased methodology and our articles are not intended to be financial advice. It does not constitute a recommendation to buy or sell any stock, and does not take account of your objectives, or your financial situation. We aim to bring you long-term focused analysis driven by fundamental data. Note that our analysis may not factor in the latest price-sensitive company announcements or qualitative material. Simply Wall St has no position in any stocks mentioned.
About TSE:7280
Mitsuba
Manufactures and sells automotive, motorcycle, and micro mobility products in Asia, the Americas, Europe, Africa, and China.
Excellent balance sheet and good value.
Similar Companies
Market Insights

Advertisement
Community Narratives
The company that turned a verb into a global necessity and basically runs the modern internet, digital ads, smartphones, maps, and AI.
Fair Value US$300.00|6.2% undervalued
OS
Community Contributor
Flowers Foods Pays A Fair Price For Health
Fair Value US$16.12|25.1% undervalued
NV
Community Contributor
TMX Group will thrive with 33.3% profit margin and enduring market moat
Fair Value CA$49.90|0.04% overvalued
LI
Community Contributor