
Advertisement
- Japan
- /
- Auto Components
- /
- TSE:7273
Take Care Before Jumping Onto ikuyo Co.,Ltd. (TSE:7273) Even Though It's 30% Cheaper
ikuyo Co.,Ltd. (TSE:7273) shares have had a horrible month, losing 30% after a relatively good period beforehand. Of course, over the longer-term many would still wish they owned shares as the stock's price has soared 216% in the last twelve months.
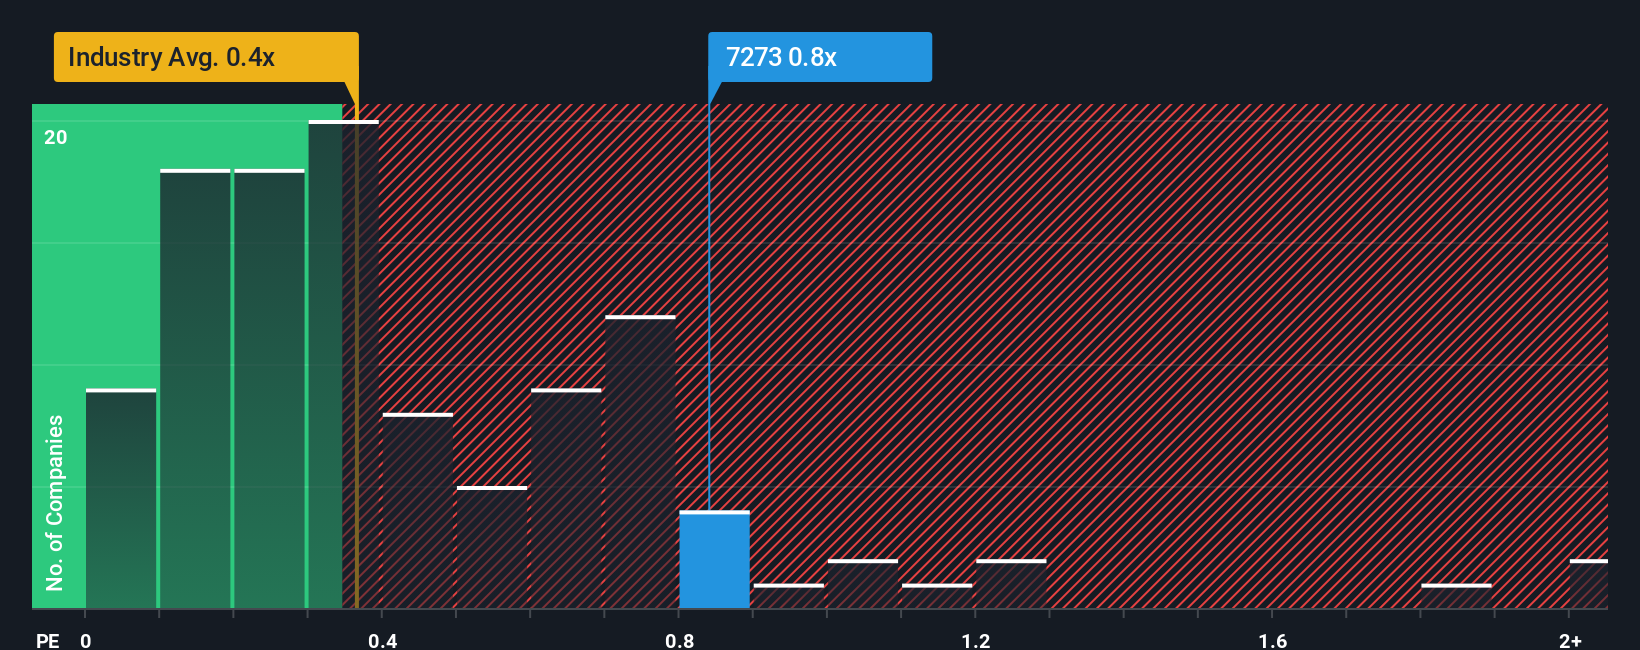
In spite of the heavy fall in price, it's still not a stretch to say that ikuyoLtd's price-to-sales (or "P/S") ratio of 0.8x right now seems quite "middle-of-the-road" compared to the Auto Components industry in Japan, where the median P/S ratio is around 0.4x. Although, it's not wise to simply ignore the P/S without explanation as investors may be disregarding a distinct opportunity or a costly mistake.
See our latest analysis for ikuyoLtd
What Does ikuyoLtd's Recent Performance Look Like?
The revenue growth achieved at ikuyoLtd over the last year would be more than acceptable for most companies. One possibility is that the P/S is moderate because investors think this respectable revenue growth might not be enough to outperform the broader industry in the near future. Those who are bullish on ikuyoLtd will be hoping that this isn't the case, so that they can pick up the stock at a lower valuation.
We don't have analyst forecasts, but you can see how recent trends are setting up the company for the future by checking out our free report on ikuyoLtd's earnings, revenue and cash flow.Is There Some Revenue Growth Forecasted For ikuyoLtd?
ikuyoLtd's P/S ratio would be typical for a company that's only expected to deliver moderate growth, and importantly, perform in line with the industry.
If we review the last year of revenue growth, the company posted a terrific increase of 17%. The latest three year period has also seen an excellent 60% overall rise in revenue, aided by its short-term performance. Accordingly, shareholders would have definitely welcomed those medium-term rates of revenue growth.
When compared to the industry's one-year growth forecast of 1.5%, the most recent medium-term revenue trajectory is noticeably more alluring
In light of this, it's curious that ikuyoLtd's P/S sits in line with the majority of other companies. Apparently some shareholders believe the recent performance is at its limits and have been accepting lower selling prices.
The Final Word
With its share price dropping off a cliff, the P/S for ikuyoLtd looks to be in line with the rest of the Auto Components industry. Generally, our preference is to limit the use of the price-to-sales ratio to establishing what the market thinks about the overall health of a company.
We've established that ikuyoLtd currently trades on a lower than expected P/S since its recent three-year growth is higher than the wider industry forecast. When we see strong revenue with faster-than-industry growth, we can only assume potential risks are what might be placing pressure on the P/S ratio. At least the risk of a price drop looks to be subdued if recent medium-term revenue trends continue, but investors seem to think future revenue could see some volatility.
Don't forget that there may be other risks. For instance, we've identified 3 warning signs for ikuyoLtd (2 don't sit too well with us) you should be aware of.
Of course, profitable companies with a history of great earnings growth are generally safer bets. So you may wish to see this free collection of other companies that have reasonable P/E ratios and have grown earnings strongly.
Valuation is complex, but we're here to simplify it.
Discover if ikuyoLtd might be undervalued or overvalued with our detailed analysis, featuring fair value estimates, potential risks, dividends, insider trades, and its financial condition.
Access Free AnalysisHave feedback on this article? Concerned about the content? Get in touch with us directly. Alternatively, email editorial-team (at) simplywallst.com.
This article by Simply Wall St is general in nature. We provide commentary based on historical data and analyst forecasts only using an unbiased methodology and our articles are not intended to be financial advice. It does not constitute a recommendation to buy or sell any stock, and does not take account of your objectives, or your financial situation. We aim to bring you long-term focused analysis driven by fundamental data. Note that our analysis may not factor in the latest price-sensitive company announcements or qualitative material. Simply Wall St has no position in any stocks mentioned.
About TSE:7273
ikuyoLtd
Manufactures, produces, and sells synthetic resin products in Japan.
Flawless balance sheet with solid track record.
Market Insights

Advertisement
Community Narratives
MicroVision will explode future revenue by 380.37% with a vision towards success
Fair Value US$60.00|98.4% undervalued
TH
Community Contributor
The Indispensable Artery for a New North American Economy
Fair Value CA$132.87|1.3% undervalued
TI
Community Contributor