
Advertisement
- Japan
- /
- Auto Components
- /
- TSE:7273
Is ikuyo Co.,Ltd.'s (TSE:7273) Stock's Recent Performance Being Led By Its Attractive Financial Prospects?
ikuyoLtd's (TSE:7273) stock is up by a considerable 40% over the past three months. Given that the market rewards strong financials in the long-term, we wonder if that is the case in this instance. Particularly, we will be paying attention to ikuyoLtd's ROE today.
Return on equity or ROE is an important factor to be considered by a shareholder because it tells them how effectively their capital is being reinvested. Put another way, it reveals the company's success at turning shareholder investments into profits.
How Do You Calculate Return On Equity?
ROE can be calculated by using the formula:
Return on Equity = Net Profit (from continuing operations) ÷ Shareholders' Equity
So, based on the above formula, the ROE for ikuyoLtd is:
22% = JP¥2.6b ÷ JP¥12b (Based on the trailing twelve months to June 2025).
The 'return' is the yearly profit. Another way to think of that is that for every ¥1 worth of equity, the company was able to earn ¥0.22 in profit.
View our latest analysis for ikuyoLtd
Why Is ROE Important For Earnings Growth?
So far, we've learned that ROE is a measure of a company's profitability. We now need to evaluate how much profit the company reinvests or "retains" for future growth which then gives us an idea about the growth potential of the company. Assuming all else is equal, companies that have both a higher return on equity and higher profit retention are usually the ones that have a higher growth rate when compared to companies that don't have the same features.
ikuyoLtd's Earnings Growth And 22% ROE
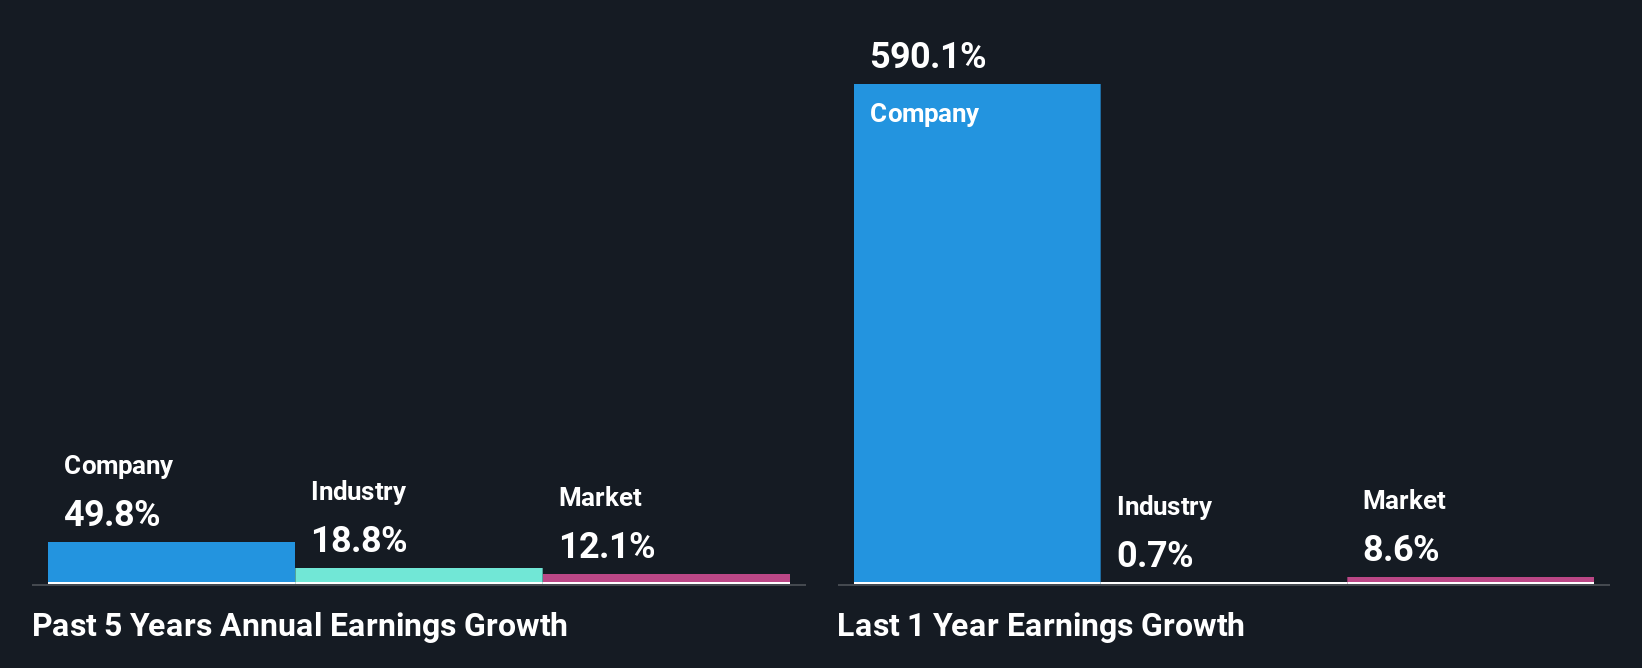
Firstly, we acknowledge that ikuyoLtd has a significantly high ROE. Second, a comparison with the average ROE reported by the industry of 7.3% also doesn't go unnoticed by us. Under the circumstances, ikuyoLtd's considerable five year net income growth of 50% was to be expected.
Next, on comparing with the industry net income growth, we found that ikuyoLtd's growth is quite high when compared to the industry average growth of 19% in the same period, which is great to see.
The basis for attaching value to a company is, to a great extent, tied to its earnings growth. It’s important for an investor to know whether the market has priced in the company's expected earnings growth (or decline). By doing so, they will have an idea if the stock is headed into clear blue waters or if swampy waters await. One good indicator of expected earnings growth is the P/E ratio which determines the price the market is willing to pay for a stock based on its earnings prospects. So, you may want to check if ikuyoLtd is trading on a high P/E or a low P/E, relative to its industry.
Is ikuyoLtd Making Efficient Use Of Its Profits?
ikuyoLtd's ' three-year median payout ratio is on the lower side at 6.2% implying that it is retaining a higher percentage (94%) of its profits. This suggests that the management is reinvesting most of the profits to grow the business as evidenced by the growth seen by the company.
Moreover, ikuyoLtd is determined to keep sharing its profits with shareholders which we infer from its long history of seven years of paying a dividend.
Conclusion
Overall, we are quite pleased with ikuyoLtd's performance. Particularly, we like that the company is reinvesting heavily into its business, and at a high rate of return. Unsurprisingly, this has led to an impressive earnings growth. If the company continues to grow its earnings the way it has, that could have a positive impact on its share price given how earnings per share influence long-term share prices. Remember, the price of a stock is also dependent on the perceived risk. Therefore investors must keep themselves informed about the risks involved before investing in any company. Our risks dashboard would have the 3 risks we have identified for ikuyoLtd.
Valuation is complex, but we're here to simplify it.
Discover if ikuyoLtd might be undervalued or overvalued with our detailed analysis, featuring fair value estimates, potential risks, dividends, insider trades, and its financial condition.
Access Free AnalysisHave feedback on this article? Concerned about the content? Get in touch with us directly. Alternatively, email editorial-team (at) simplywallst.com.
This article by Simply Wall St is general in nature. We provide commentary based on historical data and analyst forecasts only using an unbiased methodology and our articles are not intended to be financial advice. It does not constitute a recommendation to buy or sell any stock, and does not take account of your objectives, or your financial situation. We aim to bring you long-term focused analysis driven by fundamental data. Note that our analysis may not factor in the latest price-sensitive company announcements or qualitative material. Simply Wall St has no position in any stocks mentioned.
About TSE:7273
ikuyoLtd
Manufactures, produces, and sells synthetic resin products in Japan.
Solid track record with excellent balance sheet.
Market Insights

Advertisement
Community Narratives
The company that turned a verb into a global necessity and basically runs the modern internet, digital ads, smartphones, maps, and AI.
Fair Value US$300.00|7.5% undervalued
OS
Community Contributor
Flowers Foods Pays A Fair Price For Health
Fair Value US$16.12|25.4% undervalued
NV
Community Contributor
TMX Group will thrive with 33.3% profit margin and enduring market moat
Fair Value CA$49.90|3.6% overvalued
LI
Community Contributor
The "Molecular Pencil": Why Beam's Technology is Built to Win
Fair Value US$65.01|65.0% undervalued
DA
Community Contributor