
Advertisement
- Japan
- /
- Auto Components
- /
- TSE:7271
Investors Could Be Concerned With Yasunaga's (TSE:7271) Returns On Capital
When researching a stock for investment, what can tell us that the company is in decline? When we see a declining return on capital employed (ROCE) in conjunction with a declining base of capital employed, that's often how a mature business shows signs of aging. Basically the company is earning less on its investments and it is also reducing its total assets. Having said that, after a brief look, Yasunaga (TSE:7271) we aren't filled with optimism, but let's investigate further.
Understanding Return On Capital Employed (ROCE)
For those who don't know, ROCE is a measure of a company's yearly pre-tax profit (its return), relative to the capital employed in the business. The formula for this calculation on Yasunaga is:
Return on Capital Employed = Earnings Before Interest and Tax (EBIT) ÷ (Total Assets - Current Liabilities)
0.017 = JP¥319m ÷ (JP¥36b - JP¥17b) (Based on the trailing twelve months to December 2024).
Thus, Yasunaga has an ROCE of 1.7%. Ultimately, that's a low return and it under-performs the Auto Components industry average of 6.2%.
Check out our latest analysis for Yasunaga
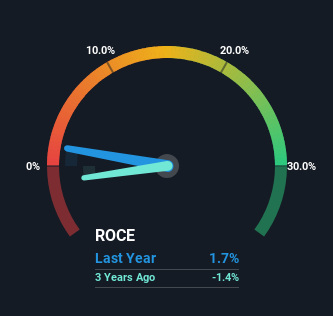
Historical performance is a great place to start when researching a stock so above you can see the gauge for Yasunaga's ROCE against it's prior returns. If you'd like to look at how Yasunaga has performed in the past in other metrics, you can view this free graph of Yasunaga's past earnings, revenue and cash flow.
What Can We Tell From Yasunaga's ROCE Trend?
In terms of Yasunaga's historical ROCE movements, the trend doesn't inspire confidence. About five years ago, returns on capital were 3.8%, however they're now substantially lower than that as we saw above. Meanwhile, capital employed in the business has stayed roughly the flat over the period. Companies that exhibit these attributes tend to not be shrinking, but they can be mature and facing pressure on their margins from competition. So because these trends aren't typically conducive to creating a multi-bagger, we wouldn't hold our breath on Yasunaga becoming one if things continue as they have.
On a side note, Yasunaga's current liabilities are still rather high at 47% of total assets. This can bring about some risks because the company is basically operating with a rather large reliance on its suppliers or other sorts of short-term creditors. Ideally we'd like to see this reduce as that would mean fewer obligations bearing risks.
In Conclusion...
In summary, it's unfortunate that Yasunaga is generating lower returns from the same amount of capital. Investors haven't taken kindly to these developments, since the stock has declined 46% from where it was five years ago. With underlying trends that aren't great in these areas, we'd consider looking elsewhere.
One final note, you should learn about the 6 warning signs we've spotted with Yasunaga (including 1 which is potentially serious) .
For those who like to invest in solid companies, check out this free list of companies with solid balance sheets and high returns on equity.
New: Manage All Your Stock Portfolios in One Place
We've created the ultimate portfolio companion for stock investors, and it's free.
• Connect an unlimited number of Portfolios and see your total in one currency
• Be alerted to new Warning Signs or Risks via email or mobile
• Track the Fair Value of your stocks
Have feedback on this article? Concerned about the content? Get in touch with us directly. Alternatively, email editorial-team (at) simplywallst.com.
This article by Simply Wall St is general in nature. We provide commentary based on historical data and analyst forecasts only using an unbiased methodology and our articles are not intended to be financial advice. It does not constitute a recommendation to buy or sell any stock, and does not take account of your objectives, or your financial situation. We aim to bring you long-term focused analysis driven by fundamental data. Note that our analysis may not factor in the latest price-sensitive company announcements or qualitative material. Simply Wall St has no position in any stocks mentioned.
About TSE:7271
Yasunaga
Manufactures and sells engine parts and machine tools, and wire saw and electronics systems.
Solid track record with adequate balance sheet.
Similar Companies
Market Insights

Advertisement
Community Narratives
The company that turned a verb into a global necessity and basically runs the modern internet, digital ads, smartphones, maps, and AI.
Fair Value US$300.00|6.3% undervalued
OS
Community Contributor
Flowers Foods Pays A Fair Price For Health
Fair Value US$16.12|26.0% undervalued
NV
Community Contributor
TMX Group will thrive with 33.3% profit margin and enduring market moat
Fair Value CA$49.90|3.7% overvalued
LI
Community Contributor