Advertisement
- Japan
- /
- Auto Components
- /
- TSE:7250
Pacific Industrial (TSE:7250) Valuation in Focus After Strong Half-Year Gains and Cautious Guidance

Simply Wall St
Reviewed by Simply Wall St
Pacific Industrial (TSE:7250) just released its half-year earnings, showcasing a solid jump in both operating profit and net sales compared to last year. At the same time, management issued guidance that points to a more cautious outlook for the rest of the year.
See our latest analysis for Pacific Industrial.
Pacific Industrial’s upbeat half-year profits and boardroom updates seem to have energized investors. The company saw a 45% share price return over the past three months and an impressive 128% gain so far this year. Its total shareholder return stands at 125% over the past year, highlighting strong momentum and renewed optimism despite recent management caution for the full year ahead.
If robust gains like this have you searching for what else is catching investors’ attention, now’s the perfect moment to discover See the full list for free.
But with Pacific Industrial’s share price now well above analyst targets after a sharp rally, investors are left to wonder whether the current valuation already reflects all the good news, or if there is still a real buying opportunity.
Price-to-Earnings of 11.6x: Is it justified?
Pacific Industrial is currently trading at a price-to-earnings (P/E) ratio of 11.6x, which puts its valuation at a premium compared to its peer group and broader market metrics.
The P/E ratio measures how much investors are willing to pay for each yen of the company's earnings. In the auto components sector, this metric is widely used to gauge whether a stock is priced sensibly relative to its profit-generating ability.
While the company's P/E ratio is below the overall Japanese market average of 14.3x, it stands slightly above the peer average of 11.3x and is very close to the sector average in auto components. However, when compared to its estimated fair price-to-earnings ratio of 9.7x, the current valuation appears stretched. This suggests that the recent rally may have priced in most of the optimism, putting the spotlight on whether Pacific Industrial can deliver the future performance required to justify or exceed this multiple.
Explore the SWS fair ratio for Pacific Industrial
Result: Price-to-Earnings of 11.6x (OVERVALUED)
However, slowing annual revenue growth and falling net income may challenge the upbeat outlook and put pressure on Pacific Industrial’s premium valuation.
Find out about the key risks to this Pacific Industrial narrative.
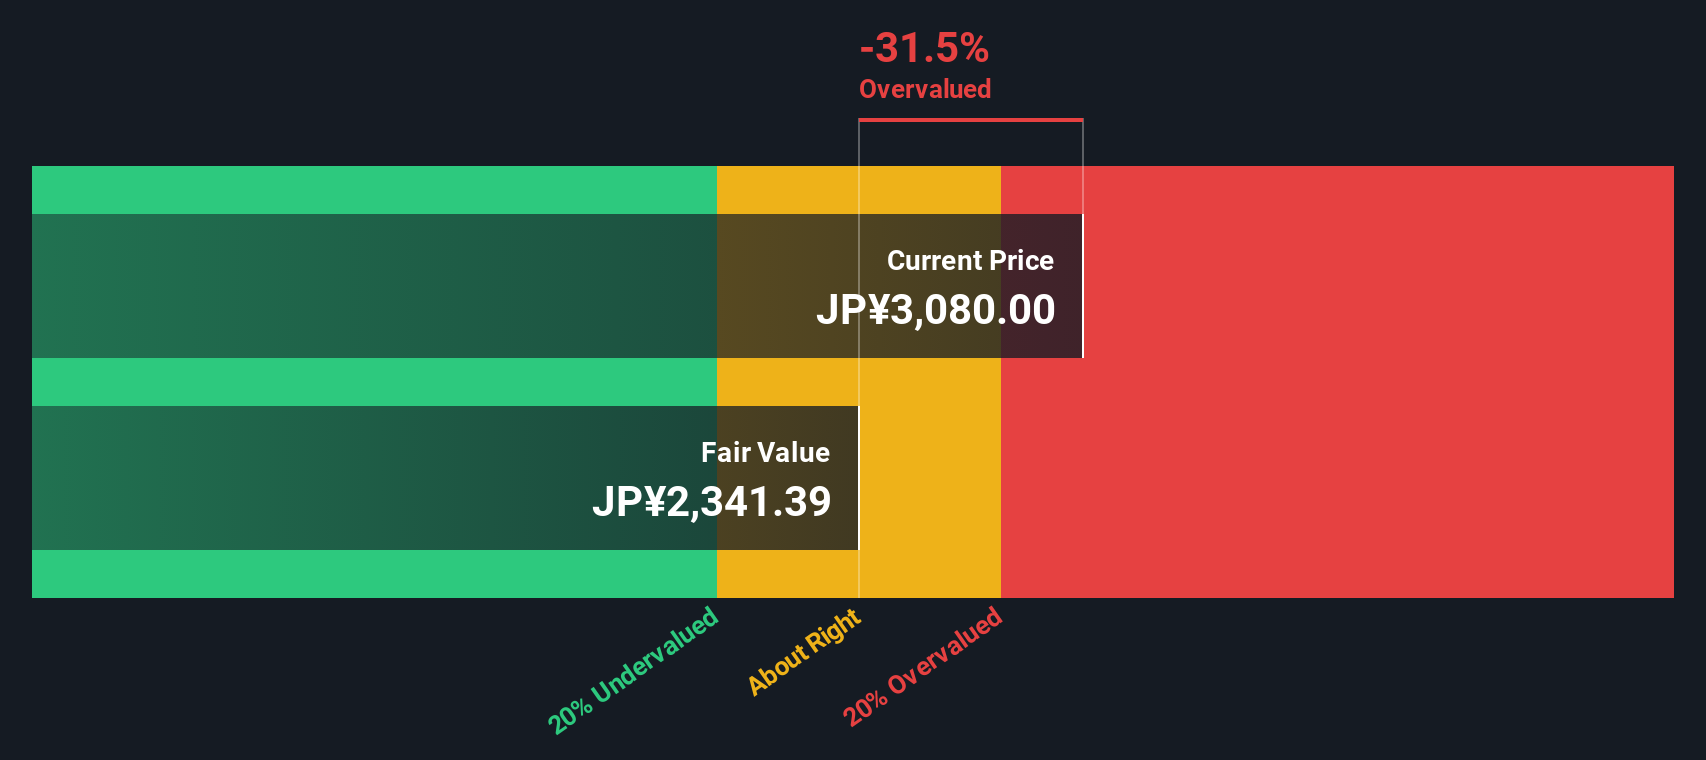
Another View: Our DCF Model Tells a Different Story
Taking a closer look using the SWS DCF model, Pacific Industrial’s shares are priced roughly 30% above its estimated fair value. While the market’s enthusiasm is clear after such strong returns, this method suggests the shares may actually be overvalued today. Could this rally be running ahead of fundamentals?
Look into how the SWS DCF model arrives at its fair value.
Simply Wall St performs a discounted cash flow (DCF) on every stock in the world every day (check out Pacific Industrial for example). We show the entire calculation in full. You can track the result in your watchlist or portfolio and be alerted when this changes, or use our stock screener to discover 850 undervalued stocks based on their cash flows. If you save a screener we even alert you when new companies match - so you never miss a potential opportunity.
Build Your Own Pacific Industrial Narrative
If you have your own perspective or want to dig deeper into Pacific Industrial’s numbers, you can quickly build your own narrative in just a few minutes. Do it your way
A great starting point for your Pacific Industrial research is our analysis highlighting 2 key rewards and 1 important warning sign that could impact your investment decision.
Looking for more investment ideas?
Still searching for your next standout opportunity? The right investment can change your portfolio’s trajectory, and you do not want to overlook these dynamic shares.
- Accelerate your portfolio’s earning power by checking out these 24 dividend stocks with yields > 3% for stocks boasting yields above 3% and steady cash returns.
- Capture the momentum of breakthroughs in medicine and technology with these 34 healthcare AI stocks, which focuses on companies innovating in healthcare artificial intelligence.
- Build wealth from the ground up by targeting these 3584 penny stocks with strong financials, where strong financials meet growth potential that others might miss.
This article by Simply Wall St is general in nature. We provide commentary based on historical data and analyst forecasts only using an unbiased methodology and our articles are not intended to be financial advice. It does not constitute a recommendation to buy or sell any stock, and does not take account of your objectives, or your financial situation. We aim to bring you long-term focused analysis driven by fundamental data. Note that our analysis may not factor in the latest price-sensitive company announcements or qualitative material. Simply Wall St has no position in any stocks mentioned.
New: Manage All Your Stock Portfolios in One Place
We've created the ultimate portfolio companion for stock investors, and it's free.
• Connect an unlimited number of Portfolios and see your total in one currency
• Be alerted to new Warning Signs or Risks via email or mobile
• Track the Fair Value of your stocks
Have feedback on this article? Concerned about the content? Get in touch with us directly. Alternatively, email editorial-team@simplywallst.com
About TSE:7250
Pacific Industrial
Manufactures and sells sell compressor-related products and electronic equipment in Japan and internationally.
Flawless balance sheet with acceptable track record.
Similar Companies
Market Insights

Advertisement
Community Narratives
The company that turned a verb into a global necessity and basically runs the modern internet, digital ads, smartphones, maps, and AI.
Fair Value US$300.00|6.2% undervalued
OS
Community Contributor
Flowers Foods Pays A Fair Price For Health
Fair Value US$16.12|25.1% undervalued
NV
Community Contributor
TMX Group will thrive with 33.3% profit margin and enduring market moat
Fair Value CA$49.90|0.04% overvalued
LI
Community Contributor