
Advertisement
- Japan
- /
- Auto Components
- /
- TSE:5101
We Think Yokohama Rubber Company (TSE:5101) Is Taking Some Risk With Its Debt
Howard Marks put it nicely when he said that, rather than worrying about share price volatility, 'The possibility of permanent loss is the risk I worry about... and every practical investor I know worries about.' So it seems the smart money knows that debt - which is usually involved in bankruptcies - is a very important factor, when you assess how risky a company is. Importantly, The Yokohama Rubber Company, Limited (TSE:5101) does carry debt. But the real question is whether this debt is making the company risky.
When Is Debt A Problem?
Debt assists a business until the business has trouble paying it off, either with new capital or with free cash flow. In the worst case scenario, a company can go bankrupt if it cannot pay its creditors. However, a more usual (but still expensive) situation is where a company must dilute shareholders at a cheap share price simply to get debt under control. Of course, the upside of debt is that it often represents cheap capital, especially when it replaces dilution in a company with the ability to reinvest at high rates of return. The first thing to do when considering how much debt a business uses is to look at its cash and debt together.
What Is Yokohama Rubber Company's Net Debt?
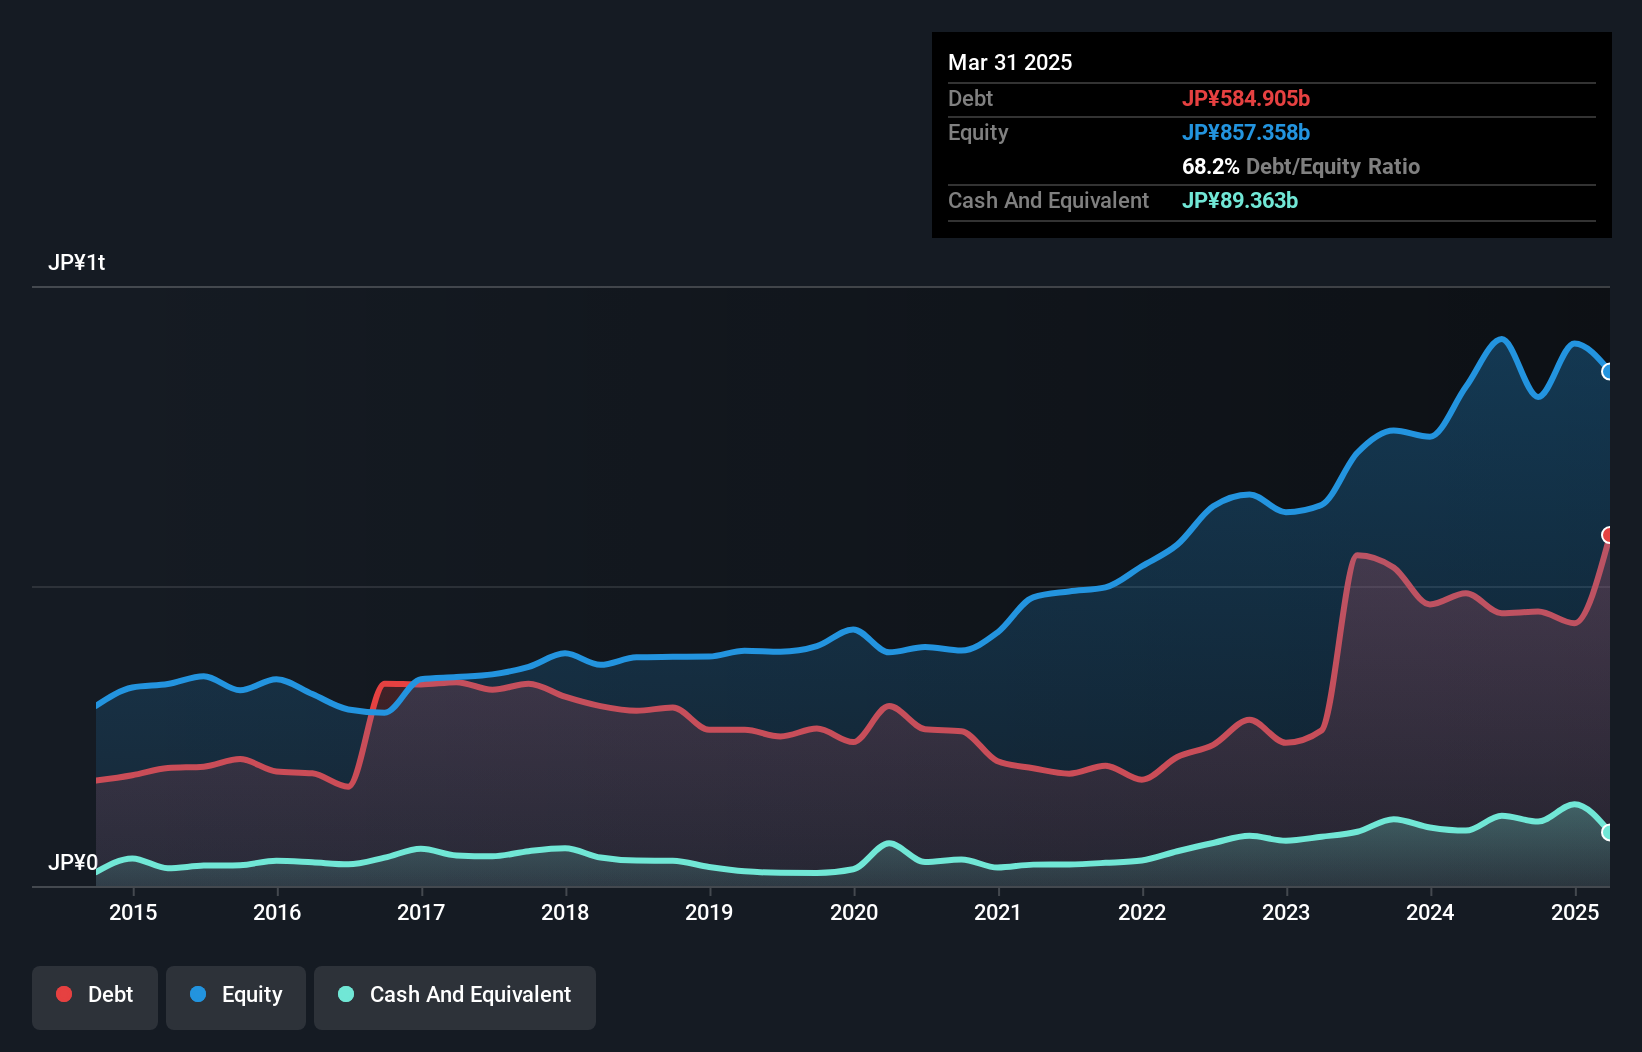
The image below, which you can click on for greater detail, shows that at March 2025 Yokohama Rubber Company had debt of JP¥584.9b, up from JP¥488.1b in one year. However, it does have JP¥89.4b in cash offsetting this, leading to net debt of about JP¥495.5b.
How Strong Is Yokohama Rubber Company's Balance Sheet?
Zooming in on the latest balance sheet data, we can see that Yokohama Rubber Company had liabilities of JP¥505.1b due within 12 months and liabilities of JP¥444.8b due beyond that. Offsetting these obligations, it had cash of JP¥89.4b as well as receivables valued at JP¥275.7b due within 12 months. So its liabilities total JP¥584.9b more than the combination of its cash and short-term receivables.
This is a mountain of leverage relative to its market capitalization of JP¥664.3b. Should its lenders demand that it shore up the balance sheet, shareholders would likely face severe dilution.
See our latest analysis for Yokohama Rubber Company
In order to size up a company's debt relative to its earnings, we calculate its net debt divided by its earnings before interest, tax, depreciation, and amortization (EBITDA) and its earnings before interest and tax (EBIT) divided by its interest expense (its interest cover). This way, we consider both the absolute quantum of the debt, as well as the interest rates paid on it.
Yokohama Rubber Company has a debt to EBITDA ratio of 2.7, which signals significant debt, but is still pretty reasonable for most types of business. However, its interest coverage of 10.7 is very high, suggesting that the interest expense on the debt is currently quite low. Importantly Yokohama Rubber Company's EBIT was essentially flat over the last twelve months. We would prefer to see some earnings growth, because that always helps diminish debt. The balance sheet is clearly the area to focus on when you are analysing debt. But ultimately the future profitability of the business will decide if Yokohama Rubber Company can strengthen its balance sheet over time. So if you want to see what the professionals think, you might find this free report on analyst profit forecasts to be interesting.
But our final consideration is also important, because a company cannot pay debt with paper profits; it needs cold hard cash. So the logical step is to look at the proportion of that EBIT that is matched by actual free cash flow. Looking at the most recent three years, Yokohama Rubber Company recorded free cash flow of 27% of its EBIT, which is weaker than we'd expect. That weak cash conversion makes it more difficult to handle indebtedness.
Our View
Neither Yokohama Rubber Company's ability to handle its total liabilities nor its conversion of EBIT to free cash flow gave us confidence in its ability to take on more debt. But the good news is it seems to be able to cover its interest expense with its EBIT with ease. When we consider all the factors discussed, it seems to us that Yokohama Rubber Company is taking some risks with its use of debt. So while that leverage does boost returns on equity, we wouldn't really want to see it increase from here. There's no doubt that we learn most about debt from the balance sheet. But ultimately, every company can contain risks that exist outside of the balance sheet. We've identified 2 warning signs with Yokohama Rubber Company (at least 1 which is a bit concerning) , and understanding them should be part of your investment process.
At the end of the day, it's often better to focus on companies that are free from net debt. You can access our special list of such companies (all with a track record of profit growth). It's free.
New: Manage All Your Stock Portfolios in One Place
We've created the ultimate portfolio companion for stock investors, and it's free.
• Connect an unlimited number of Portfolios and see your total in one currency
• Be alerted to new Warning Signs or Risks via email or mobile
• Track the Fair Value of your stocks
Have feedback on this article? Concerned about the content? Get in touch with us directly. Alternatively, email editorial-team (at) simplywallst.com.
This article by Simply Wall St is general in nature. We provide commentary based on historical data and analyst forecasts only using an unbiased methodology and our articles are not intended to be financial advice. It does not constitute a recommendation to buy or sell any stock, and does not take account of your objectives, or your financial situation. We aim to bring you long-term focused analysis driven by fundamental data. Note that our analysis may not factor in the latest price-sensitive company announcements or qualitative material. Simply Wall St has no position in any stocks mentioned.
About TSE:5101
Yokohama Rubber Company
Engages in the manufacture and sale of tires in Asia, Oceania, Europe, North America, and South America.
Excellent balance sheet, good value and pays a dividend.
Similar Companies
Market Insights

Advertisement
Community Narratives
MicroVision will explode future revenue by 380.37% with a vision towards success
Fair Value US$60.00|98.4% undervalued
TH
Community Contributor
The Indispensable Artery for a New North American Economy
Fair Value CA$132.87|1.3% undervalued
TI
Community Contributor