Advertisement
- Japan
- /
- Auto Components
- /
- TSE:3569
A Look at Seiren (TSE:3569) Valuation Following Upgraded Earnings Guidance and Dividend Increase

Simply Wall St
Reviewed by Simply Wall St
SeirenLtd (TSE:3569) announced an upward revision to its full-year earnings guidance, citing record first-half results and strong momentum in its core automotive interior and electronics materials businesses. The company also increased its interim dividend.
See our latest analysis for SeirenLtd.
SeirenLtd’s latest upward revision to earnings guidance and dividend boost have clearly energized investors, with the stock up 13.5% year-to-date and a 16.9% total shareholder return for the past year. Strong results in automotive interiors and electronics are fueling momentum, and recent board-level moves hint at further evolution. Over both the short and long term, performance has been impressive, indicating that the positive sentiment may have room to build if business strength carries through.
If Seiren’s surge has you thinking about other opportunities in the sector, now could be the perfect time to discover See the full list for free.
But with shares rallying and Seiren still trading at a discount to analyst price targets, investors may wonder if the current momentum signals more upside ahead or if the market has already priced in all of the future growth potential.
Price-to-Earnings of 12.2x: Is it justified?
SeirenLtd is trading at a price-to-earnings ratio of 12.2x, compared to peer and industry averages. The last close price was ¥3,150, signaling reasonable value in a rising market.
The price-to-earnings multiple measures how much investors are paying for each yen of earnings. It is a key tool for comparing companies within the same sector. For SeirenLtd, this ratio reflects the company’s steady profits and the market’s expectations for future growth against its competitors.
While SeirenLtd is valued below the peer average of 13.9x, it is more expensive than the Japan Auto Components industry average of 10.1x. The ratio also exceeds the estimated fair price-to-earnings level of 10.5x. This suggests the stock may be pricing in a premium for recent outperformance or anticipated future momentum.
Explore the SWS fair ratio for SeirenLtd
Result: Price-to-Earnings of 12.2x (ABOUT RIGHT)
However, slowing revenue or profit growth, as well as shifts in the automotive sector, could quickly change the outlook for SeirenLtd’s shares.
Find out about the key risks to this SeirenLtd narrative.
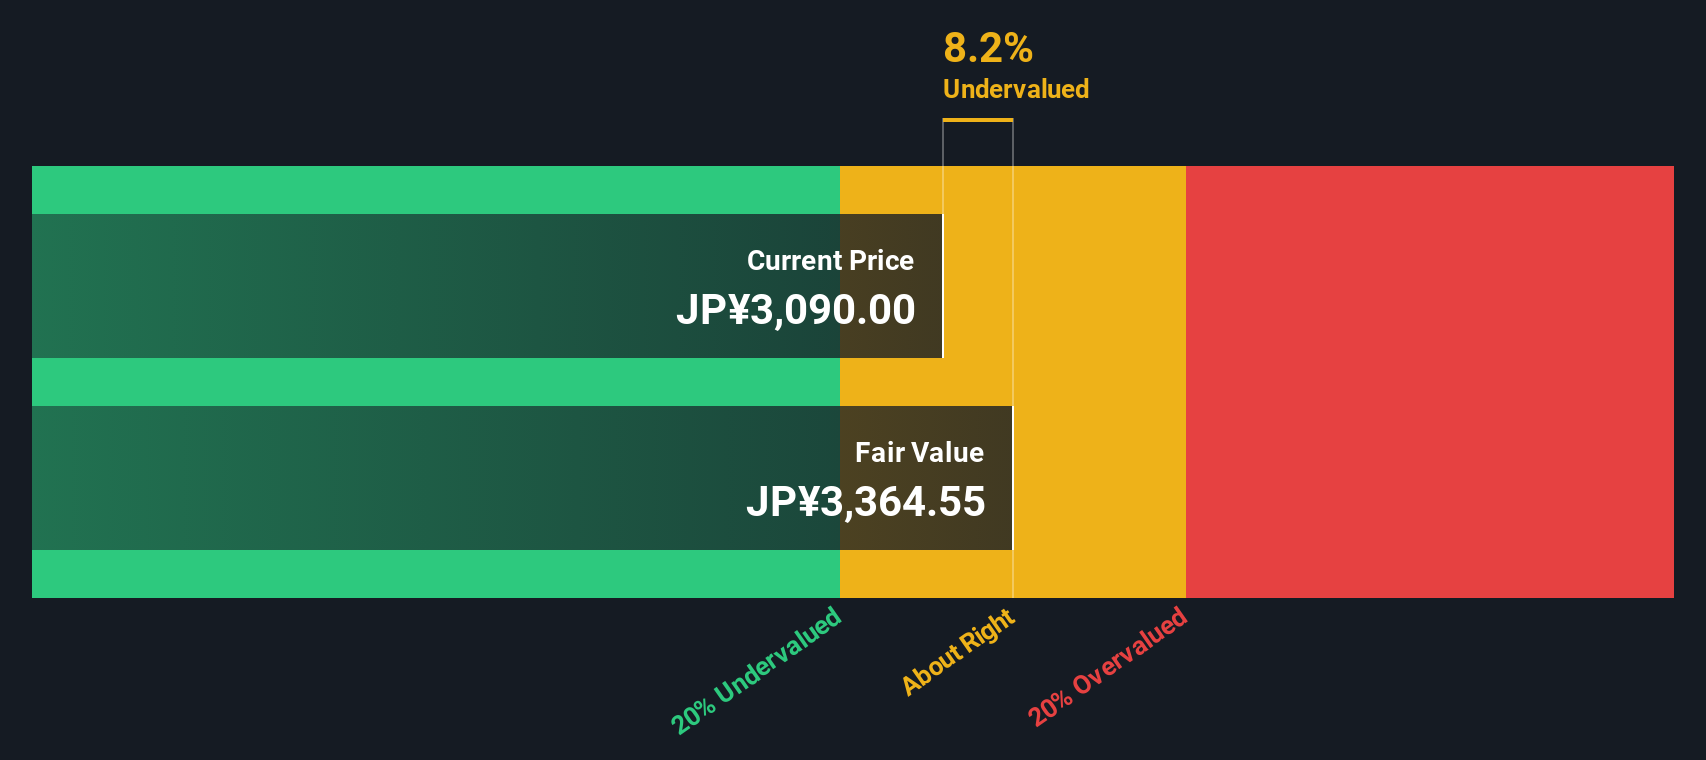
Another View: Discounted Cash Flow Model
Taking a step back from price-to-earnings, the SWS DCF model offers a different angle. It suggests SeirenLtd is trading at a 26.8% discount to its estimated fair value, indicating a bigger gap between price and fundamentals than the market’s earnings-based approach reveals. Could the stock have even more room to run?
Look into how the SWS DCF model arrives at its fair value.
Simply Wall St performs a discounted cash flow (DCF) on every stock in the world every day (check out SeirenLtd for example). We show the entire calculation in full. You can track the result in your watchlist or portfolio and be alerted when this changes, or use our stock screener to discover 917 undervalued stocks based on their cash flows. If you save a screener we even alert you when new companies match - so you never miss a potential opportunity.
Build Your Own SeirenLtd Narrative
If you have a different take or want to dive deeper into the data, you can craft your own approach in just a few minutes and Do it your way.
A good starting point is our analysis highlighting 4 key rewards investors are optimistic about regarding SeirenLtd.
Ready for Your Next Winning Stock Idea?
Smart investors never stop searching for fresh opportunities. Don’t let today’s momentum distract you from other powerful themes gaining steam in the market right now.
- Target steady income streams by exploring these 17 dividend stocks with yields > 3% offering reliable yields above 3% for growing portfolios.
- Catch the next wave of disruption with these 25 AI penny stocks leading breakthroughs in artificial intelligence across industries.
- Capitalize on future financial innovation by tracking these 81 cryptocurrency and blockchain stocks shaping the rise of blockchain and digital assets.
This article by Simply Wall St is general in nature. We provide commentary based on historical data and analyst forecasts only using an unbiased methodology and our articles are not intended to be financial advice. It does not constitute a recommendation to buy or sell any stock, and does not take account of your objectives, or your financial situation. We aim to bring you long-term focused analysis driven by fundamental data. Note that our analysis may not factor in the latest price-sensitive company announcements or qualitative material. Simply Wall St has no position in any stocks mentioned.
New: Manage All Your Stock Portfolios in One Place
We've created the ultimate portfolio companion for stock investors, and it's free.
• Connect an unlimited number of Portfolios and see your total in one currency
• Be alerted to new Warning Signs or Risks via email or mobile
• Track the Fair Value of your stocks
Have feedback on this article? Concerned about the content? Get in touch with us directly. Alternatively, email editorial-team@simplywallst.com
About TSE:3569
SeirenLtd
Manufactures and markets textile products, industrial machines, and electronic parts in Japan and internationally.
Flawless balance sheet established dividend payer.
Market Insights

Advertisement
Community Narratives
MicroVision will explode future revenue by 380.37% with a vision towards success
Fair Value US$60.00|98.4% undervalued
TH
Community Contributor
The Indispensable Artery for a New North American Economy
Fair Value CA$132.87|1.3% undervalued
TI
Community Contributor