
Advertisement
Some say volatility, rather than debt, is the best way to think about risk as an investor, but Warren Buffett famously said that 'Volatility is far from synonymous with risk.' So it seems the smart money knows that debt - which is usually involved in bankruptcies - is a very important factor, when you assess how risky a company is. As with many other companies Snam S.p.A. (BIT:SRG) makes use of debt. But is this debt a concern to shareholders?
When Is Debt A Problem?
Debt is a tool to help businesses grow, but if a business is incapable of paying off its lenders, then it exists at their mercy. Part and parcel of capitalism is the process of 'creative destruction' where failed businesses are mercilessly liquidated by their bankers. However, a more common (but still painful) scenario is that it has to raise new equity capital at a low price, thus permanently diluting shareholders. Of course, the upside of debt is that it often represents cheap capital, especially when it replaces dilution in a company with the ability to reinvest at high rates of return. The first step when considering a company's debt levels is to consider its cash and debt together.
View our latest analysis for Snam
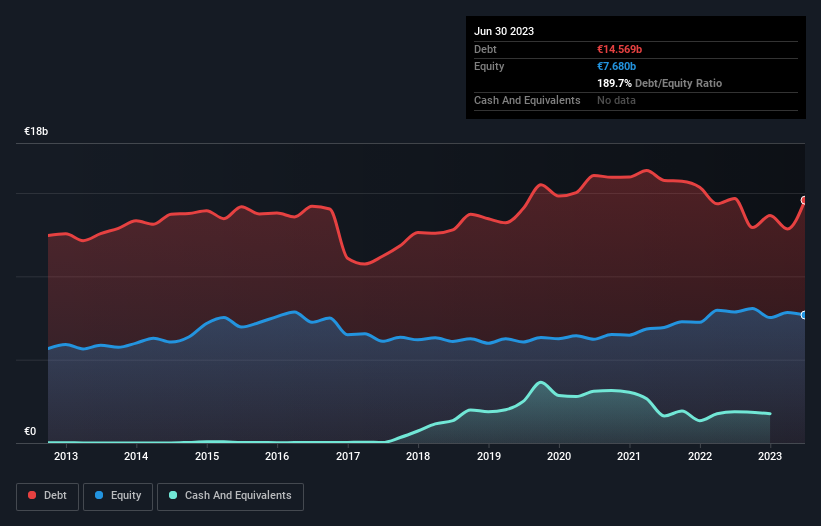
How Much Debt Does Snam Carry?
The chart below, which you can click on for greater detail, shows that Snam had €14.6b in debt in June 2023; about the same as the year before. However, because it has a cash reserve of €1.76b, its net debt is less, at about €12.8b.
A Look At Snam's Liabilities
We can see from the most recent balance sheet that Snam had liabilities of €638.0m falling due within a year, and liabilities of €14.6b due beyond that. On the other hand, it had cash of €1.76b and €4.73b worth of receivables due within a year. So it has liabilities totalling €8.78b more than its cash and near-term receivables, combined.
Snam has a very large market capitalization of €16.0b, so it could very likely raise cash to ameliorate its balance sheet, if the need arose. But we definitely want to keep our eyes open to indications that its debt is bringing too much risk.
In order to size up a company's debt relative to its earnings, we calculate its net debt divided by its earnings before interest, tax, depreciation, and amortization (EBITDA) and its earnings before interest and tax (EBIT) divided by its interest expense (its interest cover). The advantage of this approach is that we take into account both the absolute quantum of debt (with net debt to EBITDA) and the actual interest expenses associated with that debt (with its interest cover ratio).
Snam's net debt to EBITDA ratio is 5.5 which suggests rather high debt levels, but its interest cover of 8.7 times suggests the debt is easily serviced. Overall we'd say it seems likely the company is carrying a fairly heavy swag of debt. Importantly Snam's EBIT was essentially flat over the last twelve months. Ideally it can diminish its debt load by kick-starting earnings growth. There's no doubt that we learn most about debt from the balance sheet. But ultimately the future profitability of the business will decide if Snam can strengthen its balance sheet over time. So if you want to see what the professionals think, you might find this free report on analyst profit forecasts to be interesting.
Finally, while the tax-man may adore accounting profits, lenders only accept cold hard cash. So the logical step is to look at the proportion of that EBIT that is matched by actual free cash flow. In the last three years, Snam's free cash flow amounted to 37% of its EBIT, less than we'd expect. That weak cash conversion makes it more difficult to handle indebtedness.
Our View
Snam's struggle handle its debt, based on its EBITDA, had us second guessing its balance sheet strength, but the other data-points we considered were relatively redeeming. But on the bright side, its ability to to cover its interest expense with its EBIT isn't too shabby at all. We should also note that Gas Utilities industry companies like Snam commonly do use debt without problems. We think that Snam's debt does make it a bit risky, after considering the aforementioned data points together. That's not necessarily a bad thing, since leverage can boost returns on equity, but it is something to be aware of. When analysing debt levels, the balance sheet is the obvious place to start. However, not all investment risk resides within the balance sheet - far from it. For instance, we've identified 4 warning signs for Snam (2 can't be ignored) you should be aware of.
At the end of the day, it's often better to focus on companies that are free from net debt. You can access our special list of such companies (all with a track record of profit growth). It's free.
New: Manage All Your Stock Portfolios in One Place
We've created the ultimate portfolio companion for stock investors, and it's free.
• Connect an unlimited number of Portfolios and see your total in one currency
• Be alerted to new Warning Signs or Risks via email or mobile
• Track the Fair Value of your stocks
Have feedback on this article? Concerned about the content? Get in touch with us directly. Alternatively, email editorial-team (at) simplywallst.com.
This article by Simply Wall St is general in nature. We provide commentary based on historical data and analyst forecasts only using an unbiased methodology and our articles are not intended to be financial advice. It does not constitute a recommendation to buy or sell any stock, and does not take account of your objectives, or your financial situation. We aim to bring you long-term focused analysis driven by fundamental data. Note that our analysis may not factor in the latest price-sensitive company announcements or qualitative material. Simply Wall St has no position in any stocks mentioned.
About BIT:SRG
Snam
Engages in the operation of natural gas transport and storage infrastructure.
Average dividend payer and fair value.
Similar Companies
Market Insights

Advertisement
Community Narratives
The company that turned a verb into a global necessity and basically runs the modern internet, digital ads, smartphones, maps, and AI.
Fair Value US$300.00|5.2% undervalued
OS
Community Contributor
Flowers Foods Pays A Fair Price For Health
Fair Value US$16.12|24.9% undervalued
NV
Community Contributor
TMX Group will thrive with 33.3% profit margin and enduring market moat
Fair Value CA$49.90|3.3% overvalued
LI
Community Contributor
The "Molecular Pencil": Why Beam's Technology is Built to Win
Fair Value US$65.01|64.5% undervalued
DA
Community Contributor