
Advertisement
- Italy
- /
- Renewable Energy
- /
- BIT:RNG
Are Strong Financial Prospects The Force That Is Driving The Momentum In Renergetica S.p.A.'s BIT:RNG) Stock?
Renergetica (BIT:RNG) has had a great run on the share market with its stock up by a significant 60% over the last week. Given that the market rewards strong financials in the long-term, we wonder if that is the case in this instance. Specifically, we decided to study Renergetica's ROE in this article.
Return on equity or ROE is an important factor to be considered by a shareholder because it tells them how effectively their capital is being reinvested. Simply put, it is used to assess the profitability of a company in relation to its equity capital.
See our latest analysis for Renergetica
How To Calculate Return On Equity?
The formula for return on equity is:
Return on Equity = Net Profit (from continuing operations) ÷ Shareholders' Equity
So, based on the above formula, the ROE for Renergetica is:
17% = €2.5m ÷ €15m (Based on the trailing twelve months to December 2022).
The 'return' is the yearly profit. One way to conceptualize this is that for each €1 of shareholders' capital it has, the company made €0.17 in profit.
What Is The Relationship Between ROE And Earnings Growth?
We have already established that ROE serves as an efficient profit-generating gauge for a company's future earnings. Based on how much of its profits the company chooses to reinvest or "retain", we are then able to evaluate a company's future ability to generate profits. Assuming all else is equal, companies that have both a higher return on equity and higher profit retention are usually the ones that have a higher growth rate when compared to companies that don't have the same features.
A Side By Side comparison of Renergetica's Earnings Growth And 17% ROE
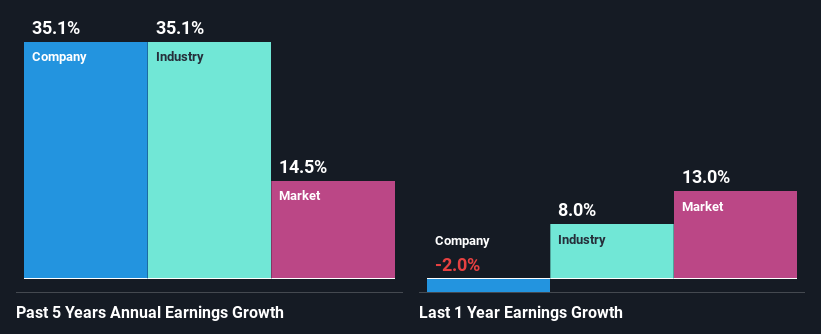
To start with, Renergetica's ROE looks acceptable. Further, the company's ROE is similar to the industry average of 17%. This certainly adds some context to Renergetica's exceptional 35% net income growth seen over the past five years. We believe that there might also be other aspects that are positively influencing the company's earnings growth. For example, it is possible that the company's management has made some good strategic decisions, or that the company has a low payout ratio.
We then performed a comparison between Renergetica's net income growth with the industry, which revealed that the company's growth is similar to the average industry growth of 35% in the same 5-year period.
Earnings growth is an important metric to consider when valuing a stock. What investors need to determine next is if the expected earnings growth, or the lack of it, is already built into the share price. By doing so, they will have an idea if the stock is headed into clear blue waters or if swampy waters await. One good indicator of expected earnings growth is the P/E ratio which determines the price the market is willing to pay for a stock based on its earnings prospects. So, you may want to check if Renergetica is trading on a high P/E or a low P/E, relative to its industry.
Is Renergetica Using Its Retained Earnings Effectively?
Given that Renergetica doesn't pay any dividend to its shareholders, we infer that the company has been reinvesting all of its profits to grow its business.
Conclusion
In total, we are pretty happy with Renergetica's performance. Specifically, we like that the company is reinvesting a huge chunk of its profits at a high rate of return. This of course has caused the company to see substantial growth in its earnings. That being so, a study of the latest analyst forecasts show that the company is expected to see a slowdown in its future earnings growth. Are these analysts expectations based on the broad expectations for the industry, or on the company's fundamentals? Click here to be taken to our analyst's forecasts page for the company.
New: AI Stock Screener & Alerts
Our new AI Stock Screener scans the market every day to uncover opportunities.
• Dividend Powerhouses (3%+ Yield)
• Undervalued Small Caps with Insider Buying
• High growth Tech and AI Companies
Or build your own from over 50 metrics.
Have feedback on this article? Concerned about the content? Get in touch with us directly. Alternatively, email editorial-team (at) simplywallst.com.
This article by Simply Wall St is general in nature. We provide commentary based on historical data and analyst forecasts only using an unbiased methodology and our articles are not intended to be financial advice. It does not constitute a recommendation to buy or sell any stock, and does not take account of your objectives, or your financial situation. We aim to bring you long-term focused analysis driven by fundamental data. Note that our analysis may not factor in the latest price-sensitive company announcements or qualitative material. Simply Wall St has no position in any stocks mentioned.
About BIT:RNG
Renergetica
Renergetica S.p.A., a smart energy company, provides a suite of development, engineering, and asset management services for renewable energy plants and energy storage solutions worldwide.
High growth potential with excellent balance sheet.
Market Insights

Advertisement
Community Narratives
The company that turned a verb into a global necessity and basically runs the modern internet, digital ads, smartphones, maps, and AI.
Fair Value US$300.00|5.1% undervalued
OS
Community Contributor
Flowers Foods Pays A Fair Price For Health
Fair Value US$16.12|27.7% undervalued
NV
Community Contributor
TMX Group will thrive with 33.3% profit margin and enduring market moat
Fair Value CA$49.90|0.2% overvalued
LI
Community Contributor
The "Molecular Pencil": Why Beam's Technology is Built to Win
Fair Value US$65.01|64.4% undervalued
DA
Community Contributor