
Advertisement
Today we'll take a closer look at A2A S.p.A. (BIT:A2A) from a dividend investor's perspective. Owning a strong business and reinvesting the dividends is widely seen as an attractive way of growing your wealth. Unfortunately, it's common for investors to be enticed in by the seemingly attractive yield, and lose money when the company has to cut its dividend payments.
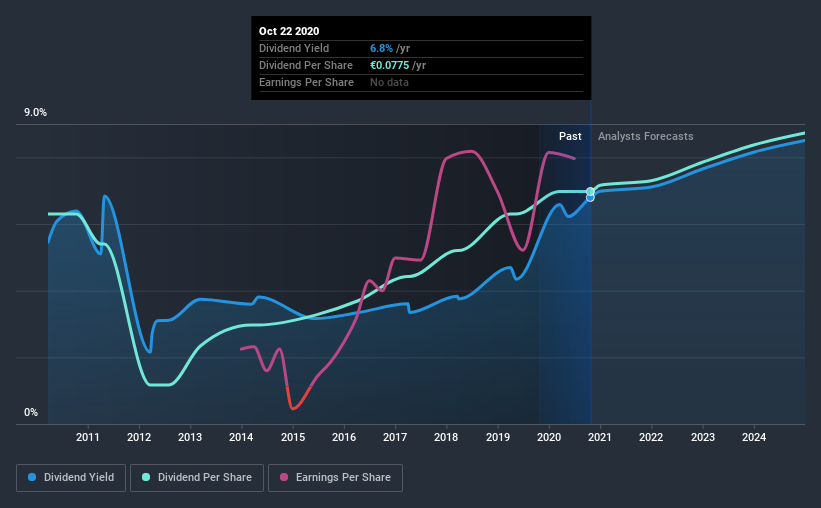
With A2A yielding 6.8% and having paid a dividend for over 10 years, many investors likely find the company quite interesting. We'd guess that plenty of investors have purchased it for the income. There are a few simple ways to reduce the risks of buying A2A for its dividend, and we'll go through these below.
Click the interactive chart for our full dividend analysis
Payout ratios
Dividends are usually paid out of company earnings. If a company is paying more than it earns, then the dividend might become unsustainable - hardly an ideal situation. Comparing dividend payments to a company's net profit after tax is a simple way of reality-checking whether a dividend is sustainable. In the last year, A2A paid out 64% of its profit as dividends. This is a healthy payout ratio, and while it does limit the amount of earnings that can be reinvested in the business, there is also some room to lift the payout ratio over time.
We also measure dividends paid against a company's levered free cash flow, to see if enough cash was generated to cover the dividend. A2A paid out 185% of its free cash flow last year, which we think is concerning if cash flows do not improve. Paying out such a high percentage of cash flow suggests that the dividend was funded from either cash at bank or by borrowing, neither of which is desirable over the long term. While A2A's dividends were covered by the company's reported profits, free cash flow is somewhat more important, so it's not great to see that the company didn't generate enough cash to pay its dividend. Cash is king, as they say, and were A2A to repeatedly pay dividends that aren't well covered by cashflow, we would consider this a warning sign.
Consider getting our latest analysis on A2A's financial position here.
Dividend Volatility
From the perspective of an income investor who wants to earn dividends for many years, there is not much point buying a stock if its dividend is regularly cut or is not reliable. For the purpose of this article, we only scrutinise the last decade of A2A's dividend payments. The dividend has been cut on at least one occasion historically. During the past 10-year period, the first annual payment was €0.07 in 2010, compared to €0.08 last year. Dividends per share have grown at approximately 1.0% per year over this time. The growth in dividends has not been linear, but the CAGR is a decent approximation of the rate of change over this time frame.
Modest growth in the dividend is good to see, but we think this is offset by historical cuts to the payments. It is hard to live on a dividend income if the company's earnings are not consistent.
Dividend Growth Potential
With a relatively unstable dividend, it's even more important to see if earnings per share (EPS) are growing. Why take the risk of a dividend getting cut, unless there's a good chance of bigger dividends in future? Strong earnings per share (EPS) growth might encourage our interest in the company despite fluctuating dividends, which is why it's great to see A2A has grown its earnings per share at 32% per annum over the past five years. With recent, rapid earnings per share growth and a payout ratio of 64%, this business looks like an interesting prospect if earnings are reinvested effectively.
Conclusion
Dividend investors should always want to know if a) a company's dividends are affordable, b) if there is a track record of consistent payments, and c) if the dividend is capable of growing. First, the company has a payout ratio that was within an average range for most dividend stocks, but it paid out virtually all of its generated cash flow. Next, earnings growth has been good, but unfortunately the dividend has been cut at least once in the past. Ultimately, A2A comes up short on our dividend analysis. It's not that we think it is a bad company - just that there are likely more appealing dividend prospects out there on this analysis.
Investors generally tend to favour companies with a consistent, stable dividend policy as opposed to those operating an irregular one. Meanwhile, despite the importance of dividend payments, they are not the only factors our readers should know when assessing a company. As an example, we've identified 2 warning signs for A2A that you should be aware of before investing.
We have also put together a list of global stocks with a market capitalisation above $1bn and yielding more 3%.
If you decide to trade A2A, use the lowest-cost* platform that is rated #1 Overall by Barron’s, Interactive Brokers. Trade stocks, options, futures, forex, bonds and funds on 135 markets, all from a single integrated account. Promoted
New: Manage All Your Stock Portfolios in One Place
We've created the ultimate portfolio companion for stock investors, and it's free.
• Connect an unlimited number of Portfolios and see your total in one currency
• Be alerted to new Warning Signs or Risks via email or mobile
• Track the Fair Value of your stocks
This article by Simply Wall St is general in nature. It does not constitute a recommendation to buy or sell any stock, and does not take account of your objectives, or your financial situation. We aim to bring you long-term focused analysis driven by fundamental data. Note that our analysis may not factor in the latest price-sensitive company announcements or qualitative material. Simply Wall St has no position in any stocks mentioned.
*Interactive Brokers Rated Lowest Cost Broker by StockBrokers.com Annual Online Review 2020
Have feedback on this article? Concerned about the content? Get in touch with us directly. Alternatively, email editorial-team@simplywallst.com.
About BIT:A2A
A2A
Engages in the production, sale, and distribution of gas and electricity, and district heating in Italy and internationally.
Average dividend payer and fair value.
Similar Companies
Market Insights

Advertisement
Community Narratives
The company that turned a verb into a global necessity and basically runs the modern internet, digital ads, smartphones, maps, and AI.
Fair Value US$300.00|7.5% undervalued
OS
Community Contributor
Flowers Foods Pays A Fair Price For Health
Fair Value US$16.12|25.4% undervalued
NV
Community Contributor
TMX Group will thrive with 33.3% profit margin and enduring market moat
Fair Value CA$49.90|3.6% overvalued
LI
Community Contributor
The "Molecular Pencil": Why Beam's Technology is Built to Win
Fair Value US$65.01|65.0% undervalued
DA
Community Contributor