Stock Analysis
Piquadro S.p.A.'s (BIT:PQ) Stock Has Seen Strong Momentum: Does That Call For Deeper Study Of Its Financial Prospects?


Piquadro (BIT:PQ) has had a great run on the share market with its stock up by a significant 20% over the last month. As most would know, fundamentals are what usually guide market price movements over the long-term, so we decided to look at the company's key financial indicators today to determine if they have any role to play in the recent price movement. Specifically, we decided to study Piquadro's ROE in this article.
Return on equity or ROE is a key measure used to assess how efficiently a company's management is utilizing the company's capital. Put another way, it reveals the company's success at turning shareholder investments into profits.
See our latest analysis for Piquadro
How Do You Calculate Return On Equity?
The formula for return on equity is:
Return on Equity = Net Profit (from continuing operations) ÷ Shareholders' Equity
So, based on the above formula, the ROE for Piquadro is:
18% = €11m ÷ €59m (Based on the trailing twelve months to September 2023).
The 'return' is the income the business earned over the last year. Another way to think of that is that for every €1 worth of equity, the company was able to earn €0.18 in profit.
What Has ROE Got To Do With Earnings Growth?
So far, we've learned that ROE is a measure of a company's profitability. We now need to evaluate how much profit the company reinvests or "retains" for future growth which then gives us an idea about the growth potential of the company. Assuming everything else remains unchanged, the higher the ROE and profit retention, the higher the growth rate of a company compared to companies that don't necessarily bear these characteristics.
A Side By Side comparison of Piquadro's Earnings Growth And 18% ROE
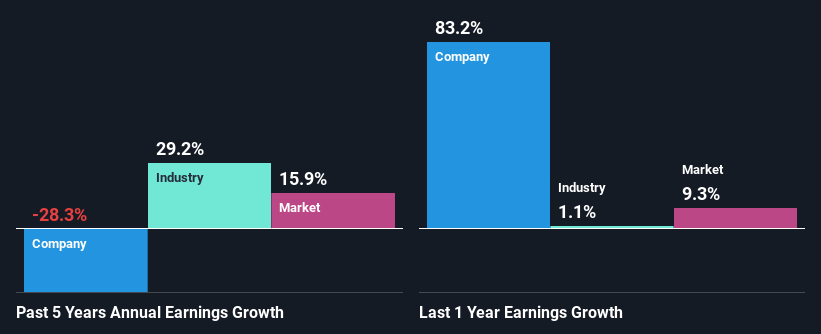
At first glance, Piquadro seems to have a decent ROE. On comparing with the average industry ROE of 12% the company's ROE looks pretty remarkable. As you might expect, the 28% net income decline reported by Piquadro is a bit of a surprise. Therefore, there might be some other aspects that could explain this. For example, it could be that the company has a high payout ratio or the business has allocated capital poorly, for instance.
However, when we compared Piquadro's growth with the industry we found that while the company's earnings have been shrinking, the industry has seen an earnings growth of 29% in the same period. This is quite worrisome.
The basis for attaching value to a company is, to a great extent, tied to its earnings growth. It’s important for an investor to know whether the market has priced in the company's expected earnings growth (or decline). Doing so will help them establish if the stock's future looks promising or ominous. Is Piquadro fairly valued compared to other companies? These 3 valuation measures might help you decide.
Is Piquadro Using Its Retained Earnings Effectively?
Piquadro's declining earnings is not surprising given how the company is spending most of its profits in paying dividends, judging by its three-year median payout ratio of 68% (or a retention ratio of 32%). The business is only left with a small pool of capital to reinvest - A vicious cycle that doesn't benefit the company in the long-run. You can see the 2 risks we have identified for Piquadro by visiting our risks dashboard for free on our platform here.
Additionally, Piquadro has paid dividends over a period of at least ten years, which means that the company's management is determined to pay dividends even if it means little to no earnings growth.
Summary
In total, it does look like Piquadro has some positive aspects to its business. However, while the company does have a high ROE, its earnings growth number is quite disappointing. This can be blamed on the fact that it reinvests only a small portion of its profits and pays out the rest as dividends. Until now, we have only just grazed the surface of the company's past performance by looking at the company's fundamentals. So it may be worth checking this free detailed graph of Piquadro's past earnings, as well as revenue and cash flows to get a deeper insight into the company's performance.
Valuation is complex, but we're helping make it simple.
Find out whether Piquadro is potentially over or undervalued by checking out our comprehensive analysis, which includes fair value estimates, risks and warnings, dividends, insider transactions and financial health.
View the Free AnalysisHave feedback on this article? Concerned about the content? Get in touch with us directly. Alternatively, email editorial-team (at) simplywallst.com.
This article by Simply Wall St is general in nature. We provide commentary based on historical data and analyst forecasts only using an unbiased methodology and our articles are not intended to be financial advice. It does not constitute a recommendation to buy or sell any stock, and does not take account of your objectives, or your financial situation. We aim to bring you long-term focused analysis driven by fundamental data. Note that our analysis may not factor in the latest price-sensitive company announcements or qualitative material. Simply Wall St has no position in any stocks mentioned.
About BIT:PQ
Piquadro
Designs, manufactures, sells, and markets leather accessories and travel products in Italy and internationally.
Flawless balance sheet with solid track record.
