Stock Analysis


Want to participate in a short research study? Help shape the future of investing tools and you could win a $250 gift card!
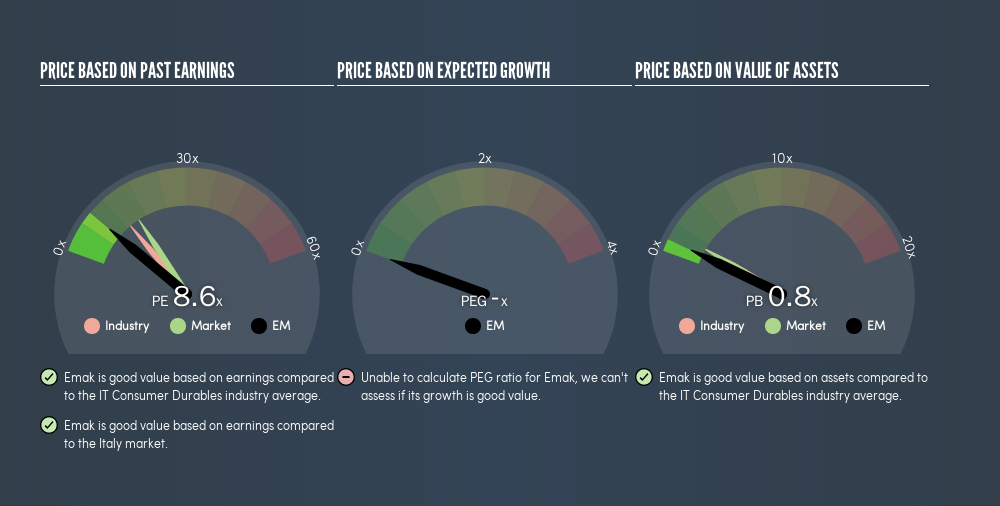
This article is for investors who would like to improve their understanding of price to earnings ratios (P/E ratios). We'll apply a basic P/E ratio analysis to Emak S.p.A.'s (BIT:EM), to help you decide if the stock is worth further research. Looking at earnings over the last twelve months, Emak has a P/E ratio of 8.55. In other words, at today's prices, investors are paying €8.55 for every €1 in prior year profit.
Check out our latest analysis for Emak
How Do You Calculate A P/E Ratio?
The formula for P/E is:
Price to Earnings Ratio = Share Price ÷ Earnings per Share (EPS)
Or for Emak:
P/E of 8.55 = €1.06 ÷ €0.12 (Based on the year to March 2019.)
Is A High Price-to-Earnings Ratio Good?
The higher the P/E ratio, the higher the price tag of a business, relative to its trailing earnings. All else being equal, it's better to pay a low price -- but as Warren Buffett said, 'It's far better to buy a wonderful company at a fair price than a fair company at a wonderful price.'
How Growth Rates Impact P/E Ratios
Generally speaking the rate of earnings growth has a profound impact on a company's P/E multiple. Earnings growth means that in the future the 'E' will be higher. That means even if the current P/E is high, it will reduce over time if the share price stays flat. Then, a lower P/E should attract more buyers, pushing the share price up.
It's great to see that Emak grew EPS by 12% in the last year. And it has bolstered its earnings per share by 15% per year over the last five years. So one might expect an above average P/E ratio.
How Does Emak's P/E Ratio Compare To Its Peers?
The P/E ratio indicates whether the market has higher or lower expectations of a company. The image below shows that Emak has a lower P/E than the average (12.9) P/E for companies in the consumer durables industry.
Its relatively low P/E ratio indicates that Emak shareholders think it will struggle to do as well as other companies in its industry classification. Since the market seems unimpressed with Emak, it's quite possible it could surprise on the upside. It is arguably worth checking if insiders are buying shares, because that might imply they believe the stock is undervalued.
Don't Forget: The P/E Does Not Account For Debt or Bank Deposits
The 'Price' in P/E reflects the market capitalization of the company. Thus, the metric does not reflect cash or debt held by the company. In theory, a company can lower its future P/E ratio by using cash or debt to invest in growth.
While growth expenditure doesn't always pay off, the point is that it is a good option to have; but one that the P/E ratio ignores.
Is Debt Impacting Emak's P/E?
Emak has net debt worth 81% of its market capitalization. This is enough debt that you'd have to make some adjustments before using the P/E ratio to compare it to a company with net cash.
The Bottom Line On Emak's P/E Ratio
Emak has a P/E of 8.6. That's below the average in the IT market, which is 15.9. While the EPS growth last year was strong, the significant debt levels reduce the number of options available to management. If the company can continue to grow earnings, then the current P/E may be unjustifiably low.
When the market is wrong about a stock, it gives savvy investors an opportunity. If it is underestimating a company, investors can make money by buying and holding the shares until the market corrects itself. So this free report on the analyst consensus forecasts could help you make a master move on this stock.
You might be able to find a better buy than Emak. If you want a selection of possible winners, check out this free list of interesting companies that trade on a P/E below 20 (but have proven they can grow earnings).
We aim to bring you long-term focused research analysis driven by fundamental data. Note that our analysis may not factor in the latest price-sensitive company announcements or qualitative material.
If you spot an error that warrants correction, please contact the editor at editorial-team@simplywallst.com. This article by Simply Wall St is general in nature. It does not constitute a recommendation to buy or sell any stock, and does not take account of your objectives, or your financial situation. Simply Wall St has no position in the stocks mentioned. Thank you for reading.
About BIT:EM
Emak
Manufactures and distributes machines, components, and accessories for gardening, forestry, agricultural, and other industries worldwide.
Good value with reasonable growth potential.
